Cincinnati Bell 2011 Annual Report Download - page 153
Download and view the complete annual report
Please find page 153 of the 2011 Cincinnati Bell annual report below. You can navigate through the pages in the report by either clicking on the pages listed below, or by using the keyword search tool below to find specific information within the annual report.-
 1
1 -
2
-
3
-
4
-
5
-
6
-
7
-
8
-
9
-
10
-
11
-
12
-
13
-
14
-
15
-
16
-
17
-
18
-
19
-
20
-
21
-
22
-
23
-
24
-
25
-
26
-
27
-
28
-
29
-
30
-
31
-
32
-
33
-
34
-
35
-
36
-
37
-
38
-
39
-
40
-
41
-
42
-
43
-
44
-
45
-
46
-
47
-
48
-
49
-
50
-
51
-
52
-
53
-
54
-
55
-
56
-
57
-
58
-
59
-
60
-
61
-
62
-
63
-
64
-
65
-
66
-
67
-
68
-
69
-
70
-
71
-
72
-
73
-
74
-
75
-
76
-
77
-
78
-
79
-
80
-
81
-
82
-
83
-
84
-
85
-
86
-
87
-
88
-
89
-
90
-
91
-
92
-
93
-
94
-
95
-
96
-
97
-
98
-
99
-
100
-
101
-
102
-
103
-
104
-
105
-
106
-
107
-
108
-
109
-
110
-
111
-
112
-
113
-
114
-
115
-
116
-
117
-
118
-
119
-
120
-
121
-
122
-
123
-
124
-
125
-
126
-
127
-
128
-
129
-
130
-
131
-
132
-
133
-
134
-
135
-
136
-
137
-
138
-
139
-
140
-
141
-
142
-
 143
143 -
 144
144 -
 145
145 -
 146
146 -
 147
147 -
 148
148 -
 149
149 -
 150
150 -
 151
151 -
 152
152 -
 153
153 -
 154
154 -
 155
155 -
 156
156 -
 157
157 -
 158
158 -
 159
159 -
 160
160 -
 161
161 -
 162
162 -
 163
163 -
164
-
165
-
166
-
167
-
168
-
169
-
170
-
171
-
172
-
173
-
174
-
175
-
176
-
177
-
178
-
179
-
180
-
181
-
182
-
183
-
184
-
185
-
186
-
187
-
188
-
189
-
190
-
191
-
192
-
193
-
194
-
195
-
196
-
197
-
198
-
199
-
200
-
201
-
202
-
203
-
204
-
205
-
206
-
207
-
208
-
209
-
210
-
211
-
212
-
213
-
214
-
215
-
216
-
217
-
218
-
219
-
220
-
221
-
222
-
223
-
224
-
225
-
226
-
227
-
228
-
229
-
230
-
231
-
232
-
233
-
234
-
235
-
236
-
237
-
238
-
239
-
240
-
241
-
242
-
243
-
244
-
245
-
246
-
247
-
248
-
249
-
250
-
251
-
252
 |
 |

Form 10-K Part II Cincinnati Bell Inc.
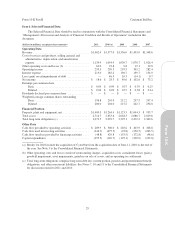
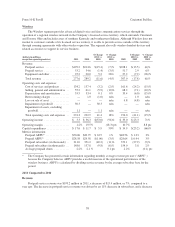
Wireline, continued
(dollars in millions, except for operating metrics) 2011 2010
$ Change
2011 vs.
2010
% Change
2011 vs.
2010 2009
$ Change
2010 vs.
2009
% Change
2010 vs.
2009
Revenue:
Voice — local service ............. $280.3 $311.9 $(31.6) (10)% $347.7 $(35.8) (10)%
Data ........................... 291.5 283.3 8.2 3% 284.3 (1.0) 0%
Long distance and VoIP ........... 111.3 104.4 6.9 7% 97.1 7.3 8%
Entertainment ................... 26.6 16.7 9.9 59% 7.7 9.0 117%
Other .......................... 22.4 26.2 (3.8) (15)% 26.3 (0.1) 0%
Total revenue .................... 732.1 742.5 (10.4) (1)% 763.1 (20.6) (3)%
Operating costs and expenses:
Cost of services and products ....... 270.0 256.8 13.2 5% 251.6 5.2 2%
Selling, general and administrative . . . 126.7 140.1 (13.4) (10)% 147.0 (6.9) (5)%
Depreciation and amortization ...... 102.4 103.9 (1.5) (1)% 103.9 — 0%
Restructuring charges ............. 7.7 8.2 (0.5) (6)% 12.6 (4.4) (35)%
Curtailment loss (gain) ............ 4.2 — 4.2 n/m (7.6) 7.6 n/m
Gain on sale of assets ............. (8.4) — (8.4) n/m — — n/m
Impairment of assets .............. 1.0 — 1.0 n/m — — n/m
Total operating costs and expenses . . . 503.6 509.0 (5.4) (1)% 507.5 1.5 0%
Operating income .................. $228.5 $233.5 $ (5.0) (2)% $255.6 $(22.1) (9)%
Operating margin ................... 31.2% 31.4% (0.2) pts 33.5% (2.1) pts
Capital expenditures ................ $112.6 $ 98.6 $14.0 14% $133.0 $(34.4) (26)%
Metrics information (in thousands):
Local access lines ................ 621.3 674.1 (52.8) (8)% 723.5 (49.4) (7)%
High-speed internet subscribers
DSL subscribers ................ 218.0 228.9 (10.9) (5)% 233.8 (4.9) (2)%
Fioptics internet subscribers ...... 39.3 27.2 12.1 44% 13.8 13.4 97%
257.3 256.1 1.2 0% 247.6 8.5 3%
Long distance lines ............... 447.4 482.8 (35.4) (7)% 508.3 (25.5) (5)%
Fioptics entertainment subscribers . . . 39.6 28.1 11.5 41% 15.2 12.9 85%
2011 Compared to 2010
Revenues
Voice local service revenue includes local service, value added services, digital trunking, switched access,
and information services. Voice local service revenue was $280.3 million in 2011, down $31.6 million, or 10%,
compared to 2010. These revenues have declined primarily due to fewer local access lines in use. Access lines
were 621,300 at December 31, 2011, down 52,800, or 8%, compared to a year earlier. The decline in access lines
resulted from several factors, including customers electing to solely use wireless service in lieu of traditional
local wireline service, Company-initiated disconnections of customers with credit problems, and customers
electing to use service from other providers.
Data revenue consists of Fioptics high-speed internet access, DSL high-speed internet access, dial-up
internet access, data transport, and LAN interconnection services. Data revenue was $291.5 million in 2011, up
$8.2 million, or 3%, compared to 2010. Revenue from Fioptics high-speed internet service increased to $15.8
million in 2011, up from $10.2 million in the prior year. As of December 31, 2011, high-speed internet Fioptics
customers were 39,300, which is 44% higher than a year ago. LAN service revenue also increased by $5.6
million on a year-over-year basis. Lower DSL revenue partially offset these increases. DSL subscribers of
218,000 at the end of 2011 decreased by 5% from 2010.
35
Form 10-K