Cincinnati Bell 2011 Annual Report Download - page 154
Download and view the complete annual report
Please find page 154 of the 2011 Cincinnati Bell annual report below. You can navigate through the pages in the report by either clicking on the pages listed below, or by using the keyword search tool below to find specific information within the annual report.-
 1
1 -
2
-
3
-
4
-
5
-
6
-
7
-
8
-
9
-
10
-
11
-
12
-
13
-
14
-
15
-
16
-
17
-
18
-
19
-
20
-
21
-
22
-
23
-
24
-
25
-
26
-
27
-
28
-
29
-
30
-
31
-
32
-
33
-
34
-
35
-
36
-
37
-
38
-
39
-
40
-
41
-
42
-
43
-
44
-
45
-
46
-
47
-
48
-
49
-
50
-
51
-
52
-
53
-
54
-
55
-
56
-
57
-
58
-
59
-
60
-
61
-
62
-
63
-
64
-
65
-
66
-
67
-
68
-
69
-
70
-
71
-
72
-
73
-
74
-
75
-
76
-
77
-
78
-
79
-
80
-
81
-
82
-
83
-
84
-
85
-
86
-
87
-
88
-
89
-
90
-
91
-
92
-
93
-
94
-
95
-
96
-
97
-
98
-
99
-
100
-
101
-
102
-
103
-
104
-
105
-
106
-
107
-
108
-
109
-
110
-
111
-
112
-
113
-
114
-
115
-
116
-
117
-
118
-
119
-
120
-
121
-
122
-
123
-
124
-
125
-
126
-
127
-
128
-
129
-
130
-
131
-
132
-
133
-
134
-
135
-
136
-
137
-
138
-
139
-
140
-
141
-
142
-
143
-
 144
144 -
 145
145 -
 146
146 -
 147
147 -
 148
148 -
 149
149 -
 150
150 -
 151
151 -
 152
152 -
 153
153 -
 154
154 -
 155
155 -
 156
156 -
 157
157 -
 158
158 -
 159
159 -
 160
160 -
 161
161 -
 162
162 -
 163
163 -
 164
164 -
165
-
166
-
167
-
168
-
169
-
170
-
171
-
172
-
173
-
174
-
175
-
176
-
177
-
178
-
179
-
180
-
181
-
182
-
183
-
184
-
185
-
186
-
187
-
188
-
189
-
190
-
191
-
192
-
193
-
194
-
195
-
196
-
197
-
198
-
199
-
200
-
201
-
202
-
203
-
204
-
205
-
206
-
207
-
208
-
209
-
210
-
211
-
212
-
213
-
214
-
215
-
216
-
217
-
218
-
219
-
220
-
221
-
222
-
223
-
224
-
225
-
226
-
227
-
228
-
229
-
230
-
231
-
232
-
233
-
234
-
235
-
236
-
237
-
238
-
239
-
240
-
241
-
242
-
243
-
244
-
245
-
246
-
247
-
248
-
249
-
250
-
251
-
252
 |
 |
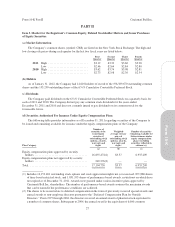
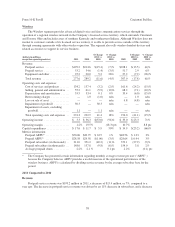
Long distance and VoIP revenue was $111.3 million in 2011, an increase of $6.9 million, or 7%, compared
to 2010. In 2011, both audio conferencing and VoIP services increased due to a larger number of subscribers and
higher usage. Partially offsetting this favorable trend, long distance residential revenue declined by $4.1 million
in 2011. As of December 31, 2011, long distance subscriber lines were 447,400, a 7% decrease compared to a
year earlier. Long distance subscriber lines have declined as consumers opt to utilize wireless and VoIP services.
Entertainment revenue was $26.6 million in 2011, up $9.9 million, or 59%, compared to the prior year due
to growth in Fioptics subscribers. As of December 31, 2011, Fioptics entertainment subscribers were 39,600, up
41% from a year ago. The Company continues to expand its Fioptics service area as there is strong consumer
demand for this service.
Other revenue was $22.4 million in 2011, down $3.8 million compared to the prior year. The sale of the
Company’s home security monitoring business decreased revenues by $2.1 million in 2011. Fewer wire
installation jobs also contributed to lower revenues compared to the prior year.
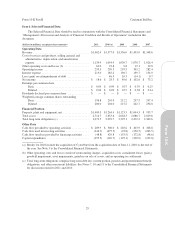
Costs and Expenses
Cost of services and products was $270.0 million in 2011, an increase of $13.2 million, or 5%, compared to
2010. Payroll related costs and contract services were up $6.6 million and $2.7 million, respectively, primarily
due to overtime associated with the start-up of Fioptics IPTV, as well as higher volumes of repair work resulting
from record rainfall in our operating territory. Network costs also increased by $6.0 million in 2011 compared to
last year as a result of growth in audio conferencing, VoIP, and Fioptics services.
SG&A expenses were $126.7 million in 2011, down $13.4 million, or 10% compared to the prior year.
Payroll and other employee related costs were down $10.1 million due to lower headcount. Contract services and
advertising costs were down $2.8 million and $1.5 million, respectively, compared to 2010. Partially offsetting
these favorable variances, legal and consulting costs and non-employee commissions were higher in 2011.
Depreciation and amortization was $102.4 million in 2011, which was down $1.5 million compared to the
prior year.
Restructuring charges were $7.7 million in 2011 compared to $8.2 million in the prior year. The Company
continues to manage the cost structure of this business. Employee separation costs were $3.5 million in 2011 and
$4.9 million in 2010. Lease abandonment costs were $2.5 million and $3.3 million in 2011 and 2010,
respectively. Contract termination costs were $1.7 million in 2011, with no such costs incurred in the prior year.
The sale of substantially all the assets associated with our home security monitoring business in 2011
resulted in a gain of $8.4 million. Curtailment losses of $4.2 million were recognized from the reduction of future
pension benefits for certain bargained employees. Asset impairment losses were $1.0 million in 2011, with no
such losses in 2010. Asset impairment losses arose from abandoned leasehold improvements related to vacated
office space and the write-down to fair value of certain assets held for sale.
Capital Expenditures
Capital expenditures are incurred to maintain the wireline network, expand the Company’s Fioptics product
suite, and upgrade its DSL network. Capital expenditures were $112.6 million in 2011, up $14.0 million from
2010. Spending to expand the Company’s Fioptics service area increased by $22.1 million from 2010 to 2011. At
December 31, 2011, the Company’s Fioptics service passes 134,000 units. The increased spending was offset by
lower spending in the expanded VoIP service areas.
36
Form 10-K Part II Cincinnati Bell Inc.