Cincinnati Bell 2011 Annual Report Download - page 54
Download and view the complete annual report
Please find page 54 of the 2011 Cincinnati Bell annual report below. You can navigate through the pages in the report by either clicking on the pages listed below, or by using the keyword search tool below to find specific information within the annual report.-
 1
1 -
2
-
3
-
4
-
5
-
6
-
7
-
8
-
9
-
10
-
11
-
12
-
13
-
14
-
15
-
16
-
17
-
18
-
19
-
20
-
21
-
22
-
23
-
24
-
25
-
26
-
27
-
28
-
29
-
30
-
31
-
32
-
33
-
34
-
35
-
36
-
37
-
38
-
39
-
40
-
41
-
42
-
43
-
 44
44 -
 45
45 -
 46
46 -
 47
47 -
 48
48 -
 49
49 -
 50
50 -
 51
51 -
 52
52 -
 53
53 -
 54
54 -
 55
55 -
 56
56 -
 57
57 -
 58
58 -
 59
59 -
 60
60 -
 61
61 -
 62
62 -
 63
63 -
 64
64 -
65
-
66
-
67
-
68
-
69
-
70
-
71
-
72
-
73
-
74
-
75
-
76
-
77
-
78
-
79
-
80
-
81
-
82
-
83
-
84
-
85
-
86
-
87
-
88
-
89
-
90
-
91
-
92
-
93
-
94
-
95
-
96
-
97
-
98
-
99
-
100
-
101
-
102
-
103
-
104
-
105
-
106
-
107
-
108
-
109
-
110
-
111
-
112
-
113
-
114
-
115
-
116
-
117
-
118
-
119
-
120
-
121
-
122
-
123
-
124
-
125
-
126
-
127
-
128
-
129
-
130
-
131
-
132
-
133
-
134
-
135
-
136
-
137
-
138
-
139
-
140
-
141
-
142
-
143
-
144
-
145
-
146
-
147
-
148
-
149
-
150
-
151
-
152
-
153
-
154
-
155
-
156
-
157
-
158
-
159
-
160
-
161
-
162
-
163
-
164
-
165
-
166
-
167
-
168
-
169
-
170
-
171
-
172
-
173
-
174
-
175
-
176
-
177
-
178
-
179
-
180
-
181
-
182
-
183
-
184
-
185
-
186
-
187
-
188
-
189
-
190
-
191
-
192
-
193
-
194
-
195
-
196
-
197
-
198
-
199
-
200
-
201
-
202
-
203
-
204
-
205
-
206
-
207
-
208
-
209
-
210
-
211
-
212
-
213
-
214
-
215
-
216
-
217
-
218
-
219
-
220
-
221
-
222
-
223
-
224
-
225
-
226
-
227
-
228
-
229
-
230
-
231
-
232
-
233
-
234
-
235
-
236
-
237
-
238
-
239
-
240
-
241
-
242
-
243
-
244
-
245
-
246
-
247
-
248
-
249
-
250
-
251
-
252
 |
 |

Executive Summary
Financial Results
In 2011, as a result of solid performance across all of its business segments, the Company achieved its
highest annual revenue and “Adjusted EBITDA”, as defined by the company, since 2003, exceeded its original
financial guidance, and continued the growth momentum of its Data Center Colocation business.
The Company’s revenue for 2011 increased $85 million, or 6%, compared to 2010. The Data Center
Colocation segment revenue increased $59 million in 2011 compared to 2010 primarily due to the acquisition of
CyrusOne in June 2010 and new business earned in 2011. In addition, the IT Services and Hardware segment
revenue increased $46 million in 2011. Offsetting these increases were declines in our traditional Wireline and
Wireless businesses. The decrease in Wireline revenue was due to continued access line loss, which was partially
mitigated by growth in Fioptics subscribers. Wireless subscribers declined by 10% in 2011 compared to 2010
driving the decrease in Wireless revenue.
Adjusted EBITDA for 2011 was $545 million compared to $519 million in 2010. Similar to the trends
described above for revenue, Data Center Colocation’s Adjusted EBITDA increased by $32 million in 2011 and
IT Services and Hardware’s Adjusted EBITDA increased by $6 million. Wireline and Wireless experienced $7
million and $3 million declines in Adjusted EBITDA, respectively. However, despite the declines in revenue,
Wireline was able to maintain an Adjusted EBITDA margin of 49%, consistent with 2010, and Wireless slightly
increased its Adjusted EBITDA margin to 32% in 2011.
In 2011, the Company continued to execute on its strategy of becoming the preferred global data center
colocation provider to the Fortune 1000 as we expanded our data center capacity by 124,000 square feet.
Customer demand for outsourced data center services is expected to be strong in future years. We plan to further
grow operations in 2012 by expanding existing data center facilities and building new facilities in new
geographies, such as Phoenix and San Antonio. In addition, we continued the investment in our Fioptics suite of
products and now pass 134,000 units. As a result of the described expansions, capital expenditures increased by
$106 million in 2011, contributing largely to the $138 million decline in free cash flow compared to 2010.
Interest payments also increased $39 million in 2011 compared to 2010 as a result of average debt outstanding
being higher in 2011 compared to the prior year primarily due to the acquisition of CyrusOne Inc. Pension and
postretirement payments and contributions also increased $18 million in the current year. The $26 million
increase in Adjusted EBITDA partially offset these decreases in free cash flow in 2011.
The “Management’s Discussion and Analysis of Financial Conditions and Results of Operations” in the
Company’s Annual Report on Form 10-K describes the Company’s 2011 financial results in greater detail.
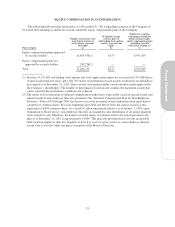
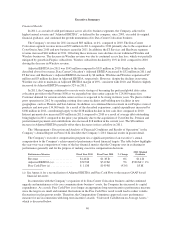
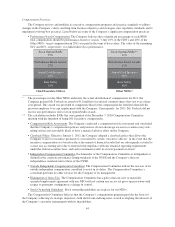
The Company’s executive compensation program ties a significant portion of an executive’s annual
compensation to the Company’s achievement of performance-based financial targets. The table below highlights
the year-over-year comparison of some of the key financial metrics that the Company uses in evaluating its
performance generally and for the purpose of making executive compensation decisions.
Performance Measure Fiscal Year 2011 Fiscal Year 2010 % Change
2011 Original
Guidance
Revenue ....................... $1.46 B $1.38 B 6% $1.4 B
Adjusted EBITDA (a) ............. $545M $519M 5% $530 M +/- 2%
Free Cash Flow (a) ............... $ 11M $149M (93)% $5 M
(a) See Annex A for a reconciliation of Adjusted EBITDA and Free Cash Flow to the nearest GAAP based
financial measures.
In connection with the Company’s expansion of its Data Center Colocation business and the continued
upgrade and maintenance of its core communications business’ assets, the Company has increased its capital
expenditures. As a result, Free Cash Flow is no longer an appropriate long term-incentive performance measure
since the targets are small and minimal fluctuations in the Free Cash Flow result would lead to rather volatile
fluctuations in plan payout results. Therefore, the Compensation Committee approved a new performance
measure for use in connection with long-term incentive awards, “Unlevered Cash Return on Average Assets,”
which is discussed below.
40