Cincinnati Bell 2011 Annual Report Download - page 64
Download and view the complete annual report
Please find page 64 of the 2011 Cincinnati Bell annual report below. You can navigate through the pages in the report by either clicking on the pages listed below, or by using the keyword search tool below to find specific information within the annual report.-
 1
1 -
2
-
3
-
4
-
5
-
6
-
7
-
8
-
9
-
10
-
11
-
12
-
13
-
14
-
15
-
16
-
17
-
18
-
19
-
20
-
21
-
22
-
23
-
24
-
25
-
26
-
27
-
28
-
29
-
30
-
31
-
32
-
33
-
34
-
35
-
36
-
37
-
38
-
39
-
40
-
41
-
42
-
43
-
44
-
45
-
46
-
47
-
48
-
49
-
50
-
51
-
52
-
53
-
 54
54 -
 55
55 -
 56
56 -
 57
57 -
 58
58 -
 59
59 -
 60
60 -
 61
61 -
 62
62 -
 63
63 -
 64
64 -
 65
65 -
 66
66 -
 67
67 -
 68
68 -
 69
69 -
 70
70 -
 71
71 -
 72
72 -
 73
73 -
 74
74 -
75
-
76
-
77
-
78
-
79
-
80
-
81
-
82
-
83
-
84
-
85
-
86
-
87
-
88
-
89
-
90
-
91
-
92
-
93
-
94
-
95
-
96
-
97
-
98
-
99
-
100
-
101
-
102
-
103
-
104
-
105
-
106
-
107
-
108
-
109
-
110
-
111
-
112
-
113
-
114
-
115
-
116
-
117
-
118
-
119
-
120
-
121
-
122
-
123
-
124
-
125
-
126
-
127
-
128
-
129
-
130
-
131
-
132
-
133
-
134
-
135
-
136
-
137
-
138
-
139
-
140
-
141
-
142
-
143
-
144
-
145
-
146
-
147
-
148
-
149
-
150
-
151
-
152
-
153
-
154
-
155
-
156
-
157
-
158
-
159
-
160
-
161
-
162
-
163
-
164
-
165
-
166
-
167
-
168
-
169
-
170
-
171
-
172
-
173
-
174
-
175
-
176
-
177
-
178
-
179
-
180
-
181
-
182
-
183
-
184
-
185
-
186
-
187
-
188
-
189
-
190
-
191
-
192
-
193
-
194
-
195
-
196
-
197
-
198
-
199
-
200
-
201
-
202
-
203
-
204
-
205
-
206
-
207
-
208
-
209
-
210
-
211
-
212
-
213
-
214
-
215
-
216
-
217
-
218
-
219
-
220
-
221
-
222
-
223
-
224
-
225
-
226
-
227
-
228
-
229
-
230
-
231
-
232
-
233
-
234
-
235
-
236
-
237
-
238
-
239
-
240
-
241
-
242
-
243
-
244
-
245
-
246
-
247
-
248
-
249
-
250
-
251
-
252
 |
 |

by the binomial value of one option/SAR for the half of the award being made in options and SARs and the value
of one performance unit for the other half being awarded in performance units. As stated above, the
Compensation Committee’s policy is not to grant more than 2,000,000 shares per year in connection with long-
term incentive awards under the 2007 Long Term Incentive Plan. To the extent that the settlement of the long-
term incentive awards in any year exceeds 2,000,000 shares, the incentives are settled in cash. The Company may
also grant SARs and performance cycle awards indexed to changes in the Company’s stock price to the NEOs
that are payable in cash instead of shares. Because of the small in-the-money value of prior years’ stock option
grants, the Compensation Committee has not considered prior years’ grants in determining amounts of stock
options granted.
In addition, as described below, certain NEOs were granted performance unit awards pursuant to the Data
Center Performance Plan.
Stock Options and SARs
Stock options and SARs are used to align the interests of management with those of the Company’s
shareholders because they are designed to provide long-term equity-based compensation tied to future
appreciation of the Company’s common share price.
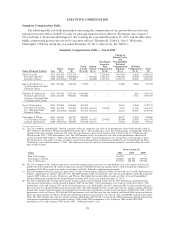
Target stock options and SARs grants for the NEOs for the fiscal year 2011-2013 performance cycle are
detailed in the Summary Compensation and Grants of Plan-Based Awards tables on pages 58 and 60 herein.
Performance Plan
Performance share or unit awards, which may be paid in common shares, cash, or a combination thereof, are
based on the achievement of specific Company quantitative goals over a three-year performance period. Such
awards are granted during the first quarter of each calendar year following finalization and approval by the full
Board of the one-year, two-year cumulative and three-year cumulative financial goal(s) for the next three-year
period.
The actual number of performance units granted is based on the long-term incentive dollar value approved
by the Compensation Committee and the value of one share of stock on the date of grant. The threshold and
target performance levels are the same for each of the NEOs. For each performance cycle, actual adjusted free
cash flow (and commencing in 2012 actual UCR Objectives) achieved must be at least 90% of the target goal in
order to generate a threshold level payout equal to 75% of the target award for each executive.
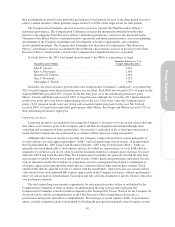
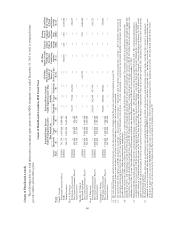
For the adjusted free cash flow one-year, two-year cumulative and three-year cumulative financial target
goals and actual results for the performance periods beginning in 2009, 2010, and 2011, see the chart
immediately below.
Performance Cycle
Threshold
Performance
Level
Cumulative
Target
Amount
Superior
Performance
Level
Actual
Results
Percentage of
Target*
2009-2011
2009 .................................... 90% $150.0 110% $150.0 100.0%
2009-2010 ................................ 90% $211.0 110% $215.2 102.0%
2009-2011 ................................ 90% $305.0 110% $291.1 95.4%
2010-2012
2010 .................................... 90% $130.0 110% $174.4 134.2%
2010-2011 ................................ 90% $161.0 110% $316.6 196.6%
2011-2013
2011 .................................... 90% $ 7.0 110% $ 36.9 527.1%
* The maximum payout on a performance cycle is 150%
For the reasons previously explained, for performance periods commencing with 2012, the Compensation
Committee and the full Board have selected the UCR Objectives as the performance measure for performance-
based awards replacing adjusted Free Cash Flow.
50