Cincinnati Bell 2011 Annual Report Download - page 222
Download and view the complete annual report
Please find page 222 of the 2011 Cincinnati Bell annual report below. You can navigate through the pages in the report by either clicking on the pages listed below, or by using the keyword search tool below to find specific information within the annual report.-
 1
1 -
2
-
3
-
4
-
5
-
6
-
7
-
8
-
9
-
10
-
11
-
12
-
13
-
14
-
15
-
16
-
17
-
18
-
19
-
20
-
21
-
22
-
23
-
24
-
25
-
26
-
27
-
28
-
29
-
30
-
31
-
32
-
33
-
34
-
35
-
36
-
37
-
38
-
39
-
40
-
41
-
42
-
43
-
44
-
45
-
46
-
47
-
48
-
49
-
50
-
51
-
52
-
53
-
54
-
55
-
56
-
57
-
58
-
59
-
60
-
61
-
62
-
63
-
64
-
65
-
66
-
67
-
68
-
69
-
70
-
71
-
72
-
73
-
74
-
75
-
76
-
77
-
78
-
79
-
80
-
81
-
82
-
83
-
84
-
85
-
86
-
87
-
88
-
89
-
90
-
91
-
92
-
93
-
94
-
95
-
96
-
97
-
98
-
99
-
100
-
101
-
102
-
103
-
104
-
105
-
106
-
107
-
108
-
109
-
110
-
111
-
112
-
113
-
114
-
115
-
116
-
117
-
118
-
119
-
120
-
121
-
122
-
123
-
124
-
125
-
126
-
127
-
128
-
129
-
130
-
131
-
132
-
133
-
134
-
135
-
136
-
137
-
138
-
139
-
140
-
141
-
142
-
143
-
144
-
145
-
146
-
147
-
148
-
149
-
150
-
151
-
152
-
153
-
154
-
155
-
156
-
157
-
158
-
159
-
160
-
161
-
162
-
163
-
164
-
165
-
166
-
167
-
168
-
169
-
170
-
171
-
172
-
173
-
174
-
175
-
176
-
177
-
178
-
179
-
180
-
181
-
182
-
183
-
184
-
185
-
186
-
187
-
188
-
189
-
190
-
191
-
192
-
193
-
194
-
195
-
196
-
197
-
198
-
199
-
200
-
201
-
202
-
203
-
204
-
205
-
206
-
207
-
208
-
209
-
210
-
211
-
 212
212 -
 213
213 -
 214
214 -
 215
215 -
 216
216 -
 217
217 -
 218
218 -
 219
219 -
 220
220 -
 221
221 -
 222
222 -
 223
223 -
 224
224 -
 225
225 -
 226
226 -
 227
227 -
 228
228 -
 229
229 -
 230
230 -
 231
231 -
 232
232 -
233
-
234
-
235
-
236
-
237
-
238
-
239
-
240
-
241
-
242
-
243
-
244
-
245
-
246
-
247
-
248
-
249
-
250
-
251
-
252
 |
 |

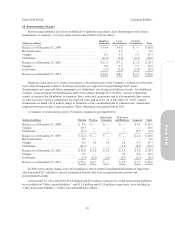
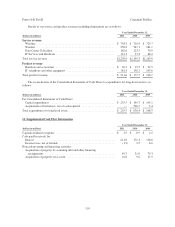
A reconciliation of the unrecognized tax benefits is as follows:
Year Ended December 31,
(dollars in millions) 2011 2010 2009
Balance, beginning of year ................................................ $20.5 $16.7 $15.6
Change in tax positions for the current year .................................. 1.3 4.0 1.1
Change in tax positions for prior years ...................................... — (0.2) —
Balance, end of year ..................................................... $21.8 $20.5 $16.7
During the year ended December 31, 2010, a change of $4.0 million was recorded due to tax matters
associated with the refinancing of the 8
3
⁄
8
% Subordinated Notes.
The Company and its subsidiaries file income tax returns in the U.S. federal jurisdiction, and various
foreign, state and local jurisdictions. With a few exceptions, the Company is no longer subject to U.S. federal,
state or local examinations for years before 2008. In 2011, the IRS completed an examination of the Company’s
U.S. federal income tax returns for 2008 and 2009.
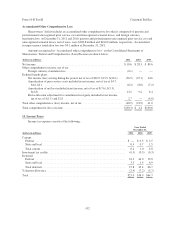
14. Stock-Based and Deferred Compensation Plans
The Company may grant stock options, stock appreciation rights, performance-based awards, and time-
based restricted shares to officers and key employees under the 2007 Long Term Incentive Plan and stock options
and restricted shares to directors under the 2007 Stock Option Plan for Non-Employee Directors. The maximum
number of shares authorized under these plans is 19.0 million. Shares available for award under the plans at
December 31, 2011 were 7.0 million.
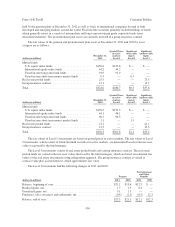
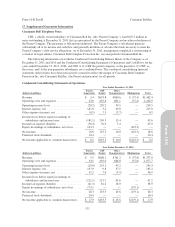
Stock Options and Stock Appreciation Rights
Generally, the awards of stock options and stock appreciation rights fully vest three years from grant date
and expire ten years from grant date. The Company generally issues new shares when options to purchase
common shares or stock appreciation rights are exercised. The following table summarizes stock options and
stock appreciation rights activity:
2011 2010 2009
(in thousands, except per share amounts) Shares
Weighted-
Average
Exercise
Price Per
Share Shares
Weighted-
Average
Exercise
Price Per
Share Shares
Weighted-
Average
Exercise
Price Per
Share
Outstanding at January 1, ................. 17,816 $ 5.55 20,172 $ 7.15 22,770 $ 9.34
Granted ............................... — — 1,374 2.99 1,918 1.47
Exercised .............................. (292) 1.74 (419) 1.58 (4) 1.75
Forfeited ............................... (261) 3.22 (464) 2.05 (248) 1.87
Expired ................................ (3,111) 14.48 (2,847) 16.83 (4,264) 16.57
Outstanding at December 31, .............. 14,152 $ 3.70 17,816 $ 5.55 20,172 $ 7.15
Expected to vest at December 31, ........... 14,152 $ 3.70 17,766 $ 5.56 20,079 $ 7.18
Exercisable at December 31, ............... 13,047 $ 3.73 14,348 $ 6.26 15,250 $ 8.76
(dollars in millions)
Compensation expense for the year .......... $ 0.9 $ 1.5 $ 3.7
Tax benefit related to compensation expense . . $ (0.3) $ (0.6) $ (1.4)
Intrinsic value of awards exercised .......... $ 0.4 $ 0.4 $ —
Cash received from awards exercised ........ $ 0.4 $ 0.5 $ —
Grant date fair value of awards vested ....... $ 2.1 $ 2.6 $ 1.6
104
Form 10-K Part II Cincinnati Bell Inc.