Cigna 2010 Annual Report Download - page 87
Download and view the complete annual report
Please find page 87 of the 2010 Cigna annual report below. You can navigate through the pages in the report by either clicking on the pages listed below, or by using the keyword search tool below to find specific information within the annual report.-
 1
1 -
2
-
3
-
4
-
5
-
6
-
7
-
8
-
9
-
10
-
11
-
12
-
13
-
14
-
15
-
16
-
17
-
18
-
19
-
20
-
21
-
22
-
23
-
24
-
25
-
26
-
27
-
28
-
29
-
30
-
31
-
32
-
33
-
34
-
35
-
36
-
37
-
38
-
39
-
40
-
41
-
42
-
43
-
44
-
45
-
46
-
47
-
48
-
49
-
50
-
51
-
52
-
53
-
54
-
55
-
56
-
57
-
58
-
59
-
60
-
61
-
62
-
63
-
64
-
65
-
66
-
67
-
68
-
69
-
70
-
71
-
72
-
73
-
74
-
75
-
76
-
 77
77 -
 78
78 -
 79
79 -
 80
80 -
 81
81 -
 82
82 -
 83
83 -
 84
84 -
 85
85 -
 86
86 -
 87
87 -
 88
88 -
 89
89 -
 90
90 -
 91
91 -
 92
92 -
 93
93 -
 94
94 -
 95
95 -
 96
96 -
 97
97 -
98
-
99
-
100
-
101
-
102
-
103
-
104
-
105
-
106
-
107
-
108
-
109
-
110
-
111
-
112
-
113
-
114
-
115
-
116
-
117
-
118
-
119
-
120
-
121
-
122
-
123
-
124
-
125
-
126
-
127
-
128
-
129
-
130
-
131
-
132
-
133
-
134
-
135
-
136
-
137
-
138
-
139
-
140
-
141
-
142
-
143
-
144
-
145
-
146
-
147
-
148
-
149
-
150
-
151
-
152
-
153
-
154
-
155
-
156
-
157
-
158
-
159
-
160
-
161
-
162
-
163
-
164
-
165
-
166
-
167
-
168
-
169
-
170
-
171
-
172
 |
 |

CIGNA CORPORATION 2010 Form 10K 67
PART II
ITEM 7 Management’s Discussion and Analysis of Financial Condition and Results of Operations
ere are seven loans where the aggregate carrying value of the
mortgage loans exceeds the value of the underlying properties by
$17 million. Five of these loans have current debt service coverage of
1.0 or greater and two with debt service coverage below 1.0 have other
risk mitigating factors including strong borrower sponsorship. As of
December 31, 2010, the mortgage portfolio contains approximately
170 loans and all but four of these loans (totaling $86 million and
considered problem commercial mortgage loans) continue to perform
under their contractual terms, resulting in an aggregate default
rate of 2.5%. e Company has $518 million of loans maturing
in the next twelve months. Given the quality and diversity of the
underlying real estate, positive debt service coverage and signifi cant
borrower cash investment averaging nearly 30%, the Company
remains confi dent that the vast majority of borrowers will continue
to perform as required. While considered unlikely, if property values
were to decrease 10% from those levels estimated during the annual
in-depth loan review, this would cause approximately 18% of the
portfolio’s carrying values to exceed the fair values of their underlying
properties, totaling $80 million.
Other Long-term Investments
e Company’s other long-term investments include $682 million
in securities partnership and real estate funds as well as direct
investments in real estate joint ventures. e funds typically invest
in mezzanine debt or equity of privately held companies (securities
partnerships) and equity real estate. Because these investments have a
subordinate position in the capital structure, the Company assumes
a higher level of risk for higher expected returns. Although the total
fair values of these investments exceeded their carrying values as of
December 31, 2010, the fair value of the Company’s ownership interest
in certain funds (those carried at cost) was less than its carrying value
by $50 million. During 2010 these investment values improved, but
remained at depressed levels refl ecting the impact of declines in value
experienced predominantly during 2008 and 2009 due to economic
weakness and disruption in the capital markets, particularly in the
commercial real estate market. e Company believes these declines
in value are temporary and expects to recover its carrying value over
the remaining lives of the funds. To mitigate risk, these investments
are diversifi ed across approximately 65 separate partnerships, and
approximately 40 general partners who manage one or more of these
partnerships. Also, the funds’ underlying investments are diversifi ed
by industry sector or property type, and geographic region. No single
investment exceeds 6% of the Company’s securities and real estate
partnership portfolio. Given the current economic environment,
future impairments are possible; however, management does not
expect those losses to have a material eff ect on the Company’s results
of operations, fi nancial condition or liquidity.
Problem and Potential Problem Investments
“Problem” bonds and commercial mortgage loans are either
delinquent by 60 days or more or have been restructured as to terms,
which could include concessions by the Company for modifi cation of
interest rate, principal payment or maturity date. “Potential problem”
bonds and commercial mortgage loans are considered current (no
payment more than 59 days past due), but management believes they
have certain characteristics that increase the likelihood that they may
become problems. e characteristics management considers include,
but are not limited to, the following:
•request from the borrower for restructuring;
•principal or interest payments past due by more than 30 but fewer
than 60 days;
•downgrade in credit rating;
•collateral losses on asset-backed securities; and
•for commercial mortgages, deterioration of debt service coverage
below 1.0 or value declines resulting in estimated loan-to-value
ratios increasing to 100% or more.
e Company recognizes interest income on problem bonds and
commercial mortgage loans only when payment is actually received
because of the risk profi le of the underlying investment. e amount
that would have been refl ected in net income if interest on non-
accrual investments had been recognized in accordance with the
original terms was not signifi cant for 2010 or 2009.
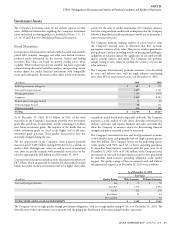
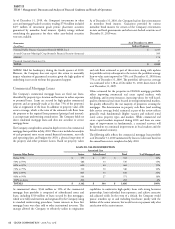
e following table shows problem and potential problem investments
at amortized cost, net of valuation reserves and write-downs:
(In millions)
December31,2010 December31,2009
Gross Reserve Net Gross Reserve Net
Problem bonds $ 86 $ (39) $ 47 $ 103 $ (49) $ 54
Problem commercial mortgage loans 90 (4) 86 169 (11) 158
Foreclosed real estate 59 - 59 59 - 59
TOTAL PROBLEM INVESTMENTS $ 235 $ 43 $ 192 $ 331 $ 60 $ 271
Potential problem bonds $ 40 $ (10) $ 30 $ 94 $ (10) $ 84
Potential problem commercial mortgage loans 305 (8) 297 245 (6) 239
TOTAL POTENTIAL PROBLEM
INVESTMENTS $ 345 $ 18 $ 327 $ 339 $ 16 $ 323
Net problem investments represent 1.0% of total investments excluding
policy loans. e Company actively managed its problem asset exposure
during 2010. Net problem investments decreased $79 million during
2010 refl ecting:
•$98 million reduction from the foreclosure and subsequent sale
or partial sale of three assets. ese partial sales represented assets
transferred to joint ventures and recapitalized with contributions
of new equity from third-party investors, resulting in the
reclassifi cation of the retained ownership interests in these assets
from foreclosed real estate to other long-term investments;
•$7 million reduction to problem bonds due to redemption activity;
and
•$26 million of additions related to two new problem mortgage
loans.