Cigna 2010 Annual Report Download - page 76
Download and view the complete annual report
Please find page 76 of the 2010 Cigna annual report below. You can navigate through the pages in the report by either clicking on the pages listed below, or by using the keyword search tool below to find specific information within the annual report.-
 1
1 -
2
-
3
-
4
-
5
-
6
-
7
-
8
-
9
-
10
-
11
-
12
-
13
-
14
-
15
-
16
-
17
-
18
-
19
-
20
-
21
-
22
-
23
-
24
-
25
-
26
-
27
-
28
-
29
-
30
-
31
-
32
-
33
-
34
-
35
-
36
-
37
-
38
-
39
-
40
-
41
-
42
-
43
-
44
-
45
-
46
-
47
-
48
-
49
-
50
-
51
-
52
-
53
-
54
-
55
-
56
-
57
-
58
-
59
-
60
-
61
-
62
-
63
-
64
-
65
-
 66
66 -
 67
67 -
 68
68 -
 69
69 -
 70
70 -
 71
71 -
 72
72 -
 73
73 -
 74
74 -
 75
75 -
 76
76 -
 77
77 -
 78
78 -
 79
79 -
 80
80 -
 81
81 -
 82
82 -
 83
83 -
 84
84 -
 85
85 -
 86
86 -
87
-
88
-
89
-
90
-
91
-
92
-
93
-
94
-
95
-
96
-
97
-
98
-
99
-
100
-
101
-
102
-
103
-
104
-
105
-
106
-
107
-
108
-
109
-
110
-
111
-
112
-
113
-
114
-
115
-
116
-
117
-
118
-
119
-
120
-
121
-
122
-
123
-
124
-
125
-
126
-
127
-
128
-
129
-
130
-
131
-
132
-
133
-
134
-
135
-
136
-
137
-
138
-
139
-
140
-
141
-
142
-
143
-
144
-
145
-
146
-
147
-
148
-
149
-
150
-
151
-
152
-
153
-
154
-
155
-
156
-
157
-
158
-
159
-
160
-
161
-
162
-
163
-
164
-
165
-
166
-
167
-
168
-
169
-
170
-
171
-
172
 |
 |

CIGNA CORPORATION 2010 Form 10K
56
PART II
ITEM 7 Management’s Discussion and Analysis of Financial Condition and Results of Operations
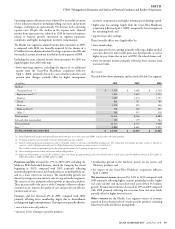
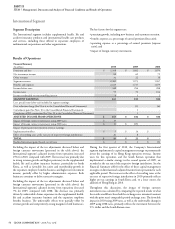
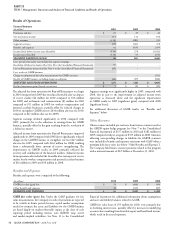
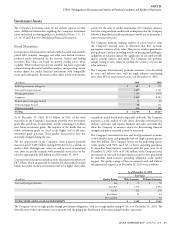
Results of Operations
Financial Summary
(In millions)
2010 2009 2008
Premiums and fees $ 25 $ 29 $ 43
Net investment income 114 113 104
Other revenues (158) (283) 331
Segment revenues (19) (141) 478
Benefi ts and expenses 91 (419) 1,499
Income (loss) before income taxes (benefi ts) (110) 278 (1,021)
Income taxes (benefi ts) (136) 93 (375)
SEGMENT EARNINGS LOSS 26 185 646
Less: special items (after-tax) included in segment earnings:
Resolution of federal tax matters (See Note 20 to the Consolidated Financial Statements) 97 - -
Loss on Reinsurance transaction (See Note 3 to the Consolidated Financial Statements) (20) - -
Less: results of GMIB business:
Charge on adoption of fair value measurements for GMIB contracts - - (131)
Results of GMIB business excluding charge on adoption (24) 209 (306)
ADJUSTED LOSS FROM OPERATIONS $ 27 $ 24 $ 209
Realized investment gains (losses), net of taxes $ 5 $ (2) $ (19)
e adjusted loss from operations for Run-off Reinsurance was larger
in 2010 compared with 2009 due to reduced favorable after-tax impact
of reserve studies ($6 million for 2010 compared to $16 million
for 2009) and settlements and commutations ($3 million for 2010
compared to $11 million in 2009) for workers compensation and
personal accident businesses, partially off set by reduced charges in
2010 to strengthen GMDB reserves ($34 million after-tax for 2010,
compared to $47 million after-tax for 2009).
Segment earnings declined signifi cantly in 2010 compared with
2009, primarily due to the reduction in earnings from the GMIB
business, partially off set by the gain resulting from the resolution of
a federal tax matter.
Adjusted income from operations for Run-off Reinsurance improved
signifi cantly in 2009 compared with 2008 due to signifi cantly reduced
charges in the GMDB business to strengthen reserves ($47 million
after-tax for 2009, compared with $263 million for 2008) resulting
from a substantially lower amount of reserve strengthening. e
improvement in GMDB results in 2009 primarily refl ected the
recovery and stabilization of the fi nancial markets. Adjusted income
from operations also included the favorable after-tax impact of reserve
studies for the workers compensation and personal accident business
of $16 million in 2009 and $30 million in 2008.
Segment earnings were signifi cantly higher in 2009, compared with
2008, due in part to the improvement in adjusted income from
operations as discussed above and the signifi cant improvement
in GMIB results in 2009 (signifi cant gains) compared with 2008
(signifi cant losses).
For additional discussion of GMIB results, see “Benefi ts and
Expenses” below.
Other Revenues
Other revenues included pre-tax losses from futures contracts used in
the GMDB equity hedge program (see Note 7 to the Consolidated
Financial Statements) of $157 million in 2010 and $282 million in
2009 compared with pre-tax gains of $333 million in 2008. Amounts
refl ecting corresponding changes in liabilities for GMDB contracts
were included in benefi ts and expenses consistent with GAAP when a
premium defi ciency exists (see below “Other Benefi ts and Expenses”).
e Company held futures contract positions related to this program
with a notional amount of $0.9 billion at December 31, 2010.
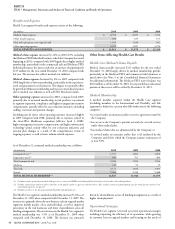
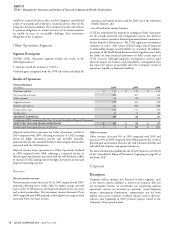
Benefi ts and Expenses
Benefi ts and expenses were comprised of the following:
(In millions)
2010 2009 2008
GMIB fair value (gain) loss $ 55 $ (304) $ 690
Other benefi ts and expenses 36 (115) 809
BENEFITS AND EXPENSES $91 $ 419 $ 1,499
GMIB fair value (gain) loss. Under the GAAP guidance for fair
value measurements, the Company’s results of operations are expected
to be volatile in future periods because capital market assumptions
needed to estimate the assets and liabilities for the GMIB business
are based largely on market-observable inputs at the close of each
reporting period including interest rates (LIBOR swap curve)
and market-implied volatilities. See Note 11 to the Consolidated
Financial Statements for additional information about assumptions
and asset and liability balances related to GMIB.
GMIB fair value losses of $55 million for 2010, were primarily due
to declining interest rates, partially off set by increases in underlying
account values resulting from favorable equity and bond fund returns,
which result in decreased exposures.