Cigna 2010 Annual Report Download - page 6
Download and view the complete annual report
Please find page 6 of the 2010 Cigna annual report below. You can navigate through the pages in the report by either clicking on the pages listed below, or by using the keyword search tool below to find specific information within the annual report.-
 1
1 -
 2
2 -
 3
3 -
 4
4 -
 5
5 -
 6
6 -
 7
7 -
 8
8 -
 9
9 -
 10
10 -
 11
11 -
 12
12 -
 13
13 -
 14
14 -
 15
15 -
 16
16 -
 17
17 -
18
-
19
-
20
-
21
-
22
-
23
-
24
-
25
-
26
-
27
-
28
-
29
-
30
-
31
-
32
-
33
-
34
-
35
-
36
-
37
-
38
-
39
-
40
-
41
-
42
-
43
-
44
-
45
-
46
-
47
-
48
-
49
-
50
-
51
-
52
-
53
-
54
-
55
-
56
-
57
-
58
-
59
-
60
-
61
-
62
-
63
-
64
-
65
-
66
-
67
-
68
-
69
-
70
-
71
-
72
-
73
-
74
-
75
-
76
-
77
-
78
-
79
-
80
-
81
-
82
-
83
-
84
-
85
-
86
-
87
-
88
-
89
-
90
-
91
-
92
-
93
-
94
-
95
-
96
-
97
-
98
-
99
-
100
-
101
-
102
-
103
-
104
-
105
-
106
-
107
-
108
-
109
-
110
-
111
-
112
-
113
-
114
-
115
-
116
-
117
-
118
-
119
-
120
-
121
-
122
-
123
-
124
-
125
-
126
-
127
-
128
-
129
-
130
-
131
-
132
-
133
-
134
-
135
-
136
-
137
-
138
-
139
-
140
-
141
-
142
-
143
-
144
-
145
-
146
-
147
-
148
-
149
-
150
-
151
-
152
-
153
-
154
-
155
-
156
-
157
-
158
-
159
-
160
-
161
-
162
-
163
-
164
-
165
-
166
-
167
-
168
-
169
-
170
-
171
-
172
 |
 |

4 Letter to Our Shareholders
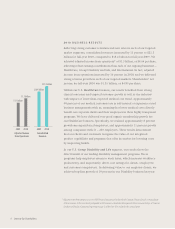
2 0 1 0 B U S I N E S S R E S U L T S
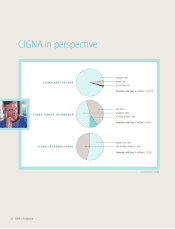
Reflecting strong customer retention and new sales in each of our targeted
market segments, consolidated revenues increased by 15 percent to $21.3
billion for full-year 2010, compared to $18.4 billion for full-year 2009. We
achieved adjusted income from operations* of $1.3 billion, or $4.64 per share,
reflecting robust earnings contributions from each of our ongoing businesses –
HealthCare, Group Disability and Life, and International. In fact, adjusted
income from operations increased by 16 percent in 2010, and we delivered
strong revenue growth in each of our targeted markets. Shareholders’ net
income for full-year 2010 was $1.35 billion, or $4.89 per share.
Within our U.S. HealthCare business, our results benefited from strong
clinical outcomes and targeted customer growth as well as the industry-
wide impact of lower-than-expected medical cost trend. Approximately
90 percent of our medical customers are in self-insured or experience-rated
business arrangements with us, meaning that lower medical costs directly
benefit our corporate clients and their employees in these highly transparent
programs. We have delivered very good organic membership growth for
our HealthCare business. Specifically, we realized approximately 8 percent
growth among mid-sized employers, and approximately 11 percent growth
among companies with 51 – 250 employees. These results demonstrate
that our clients and customers recognize the value of our integrated
product capabilities and programs that offer incentives for lowering costs
by improving health.
In our U.S. Group Disability and Life segment, our results show the
direct benefit of our leading disability management programs. These
programs help employees return to work faster, which increases workforce
productivity, and importantly, drives cost savings for clients, (employers)
and customers (employees). In delivering value to our employer clients, we
achieved top-line growth of 10 percent in our Disability business last year.
2009 2010
$1.3 billion
$1.1 billion
Adjusted Income
from Operations
2009 2010
$21.3 billion
$18.4 billion
Consolidated
Revenue
* Adjusted income from operations is a non-GAAP financial measure used to describe the Company’s financial results. A reconciliation
of these measures to the most directly comparable GAAP measure is contained in Management’s Discussion and Analysis of Financial
Condition and Results of Operations beginning on page 33 of the Form 10-K included in this annual report.