Cigna 2010 Annual Report Download - page 69
Download and view the complete annual report
Please find page 69 of the 2010 Cigna annual report below. You can navigate through the pages in the report by either clicking on the pages listed below, or by using the keyword search tool below to find specific information within the annual report.-
 1
1 -
2
-
3
-
4
-
5
-
6
-
7
-
8
-
9
-
10
-
11
-
12
-
13
-
14
-
15
-
16
-
17
-
18
-
19
-
20
-
21
-
22
-
23
-
24
-
25
-
26
-
27
-
28
-
29
-
30
-
31
-
32
-
33
-
34
-
35
-
36
-
37
-
38
-
39
-
40
-
41
-
42
-
43
-
44
-
45
-
46
-
47
-
48
-
49
-
50
-
51
-
52
-
53
-
54
-
55
-
56
-
57
-
58
-
 59
59 -
 60
60 -
 61
61 -
 62
62 -
 63
63 -
 64
64 -
 65
65 -
 66
66 -
 67
67 -
 68
68 -
 69
69 -
 70
70 -
 71
71 -
 72
72 -
 73
73 -
 74
74 -
 75
75 -
 76
76 -
 77
77 -
 78
78 -
 79
79 -
80
-
81
-
82
-
83
-
84
-
85
-
86
-
87
-
88
-
89
-
90
-
91
-
92
-
93
-
94
-
95
-
96
-
97
-
98
-
99
-
100
-
101
-
102
-
103
-
104
-
105
-
106
-
107
-
108
-
109
-
110
-
111
-
112
-
113
-
114
-
115
-
116
-
117
-
118
-
119
-
120
-
121
-
122
-
123
-
124
-
125
-
126
-
127
-
128
-
129
-
130
-
131
-
132
-
133
-
134
-
135
-
136
-
137
-
138
-
139
-
140
-
141
-
142
-
143
-
144
-
145
-
146
-
147
-
148
-
149
-
150
-
151
-
152
-
153
-
154
-
155
-
156
-
157
-
158
-
159
-
160
-
161
-
162
-
163
-
164
-
165
-
166
-
167
-
168
-
169
-
170
-
171
-
172
 |
 |

CIGNA CORPORATION 2010 Form 10K 49
PART II
ITEM 7 Management’s Discussion and Analysis of Financial Condition and Results of Operations
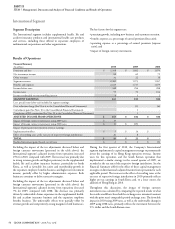
Operating expense effi ciencies were achieved by successful execution
of cost reduction initiatives including staffi ng, real estate and pension
changes, resulting in an approximately 3% decrease in the operating
expense ratio. Despite this decline in the expense ratio, adjusted
income from operations was reduced in 2010 by increased expenses
related to business growth, investment in segment expansion,
compliance and higher management incentive compensation.
e Health Care segment’s adjusted income from operations in 2009,
as compared with 2008, was favorably impacted by the absence of a
$7 million after-tax adjustment related to a large experience-rated life and
non-medical account in run-out recorded in the fi rst quarter of 2008.
Excluding this item, adjusted income from operations for 2009 was
slightly higher than 2008 refl ecting:
•lower operating expenses, excluding the impact of an additional
quarter from the Great-West Healthcare acquisition (eff ective
April 1, 2008), primarily driven by cost reduction initiatives and
pension plan changes, partially off set by higher management
incentive compensation and higher information technology spend;
•higher stop loss earnings largely from the Great-West Healthcare
acquisition (eff ective April 1, 2008), tempered by lower margins on
the remaining book; and
•improved specialty earnings.
ese favorable eff ects were largely off set by:
•lower membership;
•lower guaranteed cost earnings primarily refl ecting a higher medical
care ratio driven by unfavorable prior year development, as well as
higher in-year claims due, in part to H1N1 fl u-related claims; and
•lower investment income primarily refl ecting lower income from
real estate funds.
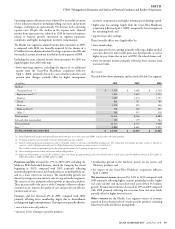
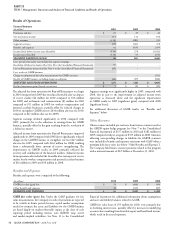
Revenues
e table below shows premiums and fees for the Health Care segment:
(In millions)
2010 2009 2008
Medical:
Guaranteed cost (1) (2) $ 3,929 $ 3,380 $ 3,704
Experience-rated (2) (3) 1,823 1,699 1,953
Stop loss 1,287 1,274 1,197
Dental 804 731 785
Medicare 1,470 595 400
Medicare Part D 558 342 327
Other (4) 543 515 518
Total medical 10,414 8,536 8,884
Life and other non-medical 103 179 184
Total premiums 10,517 8,715 9,068
Fees (2) (5) 2,802 2,669 2,597
TOTAL PREMIUMS AND FEES $ 13,319 $ 11,384 $ 11,665
(1) Includes guaranteed cost premiums primarily associated with open access and commercial HMO, as well as other risk-related products.
(2) Premiums and/or fees associated with certain specialty products are also included.
(3) Includes minimum premium arrangements with a risk profile similar to experience-rated funding arrangements. The risk portion of minimum premium revenue is reported in
experience-rated medical premium whereas the self funding portion of minimum premium revenue is recorded in fees.
Also, includes certain non-participating cases for which special customer level reporting of experience is required.
(4) Other medical premiums include risk revenue and specialty products.
(5) Represents administrative service fees for medical members and related specialty product fees for non-medical members as well as fees related to Medicare Part D of $57 million in
2010, $41 million in 2009, and $69 million in 2008.
Premiums and fees increased by 17% in 2010 (10% excluding the
Medicare PFFS Individual business, which the Company has exited
beginning in 2011), compared with 2009, primarily refl ecting
membership growth in most risk-based products, including Medicare,
and to a lesser extent rate increases. e membership growth was
driven by strong retention and new sales in targeted market segments.
e increase in fees primarily refl ects growth in specialty products.
ese increases refl ect the success of the Company’s eff orts to enhance
customer access, improve the quality of care and provide cost eff ective
products and services.
Premiums and fees decreased 2% in 2009, compared with 2008,
primarily refl ecting lower membership largely due to disenrollment
resulting from higher unemployment. is impact was partially off set by:
•rate actions across all products;
•increases in fees relating to specialty products;
•membership growth in the Medicare private fee for service and
Voluntary products; and
•the impact of the Great-West Healthcare acquisition (eff ective
April 1, 2008).
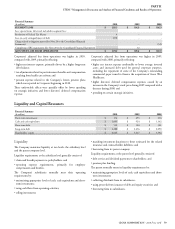
Net investment income increased by 34% in 2010 compared with
2009 primarily refl ecting higher security partnership results, higher
real estate income and increased invested assets driven by business
growth. Net investment income decreased by 10% in 2009 compared
with 2008 primarily refl ecting lower income from real estate funds
partially off set by higher invested assets.
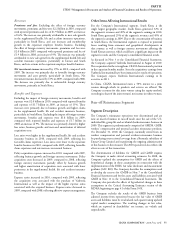
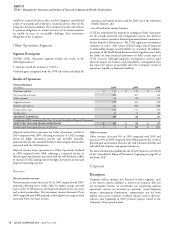
Other revenues for the Health Care segment consist of revenues
earned on direct channel sales of certain specialty products, including
behavioral health and disease management.