Cigna 2010 Annual Report Download - page 116
Download and view the complete annual report
Please find page 116 of the 2010 Cigna annual report below. You can navigate through the pages in the report by either clicking on the pages listed below, or by using the keyword search tool below to find specific information within the annual report.-
 1
1 -
2
-
3
-
4
-
5
-
6
-
7
-
8
-
9
-
10
-
11
-
12
-
13
-
14
-
15
-
16
-
17
-
18
-
19
-
20
-
21
-
22
-
23
-
24
-
25
-
26
-
27
-
28
-
29
-
30
-
31
-
32
-
33
-
34
-
35
-
36
-
37
-
38
-
39
-
40
-
41
-
42
-
43
-
44
-
45
-
46
-
47
-
48
-
49
-
50
-
51
-
52
-
53
-
54
-
55
-
56
-
57
-
58
-
59
-
60
-
61
-
62
-
63
-
64
-
65
-
66
-
67
-
68
-
69
-
70
-
71
-
72
-
73
-
74
-
75
-
76
-
77
-
78
-
79
-
80
-
81
-
82
-
83
-
84
-
85
-
86
-
87
-
88
-
89
-
90
-
91
-
92
-
93
-
94
-
95
-
96
-
97
-
98
-
99
-
100
-
101
-
102
-
103
-
104
-
105
-
 106
106 -
 107
107 -
 108
108 -
 109
109 -
 110
110 -
 111
111 -
 112
112 -
 113
113 -
 114
114 -
 115
115 -
 116
116 -
 117
117 -
 118
118 -
 119
119 -
 120
120 -
 121
121 -
 122
122 -
 123
123 -
 124
124 -
 125
125 -
 126
126 -
127
-
128
-
129
-
130
-
131
-
132
-
133
-
134
-
135
-
136
-
137
-
138
-
139
-
140
-
141
-
142
-
143
-
144
-
145
-
146
-
147
-
148
-
149
-
150
-
151
-
152
-
153
-
154
-
155
-
156
-
157
-
158
-
159
-
160
-
161
-
162
-
163
-
164
-
165
-
166
-
167
-
168
-
169
-
170
-
171
-
172
 |
 |

CIGNA CORPORATION 2010 Form 10K
96
PART II
ITEM 8 Financial Statements and Supplementary Data
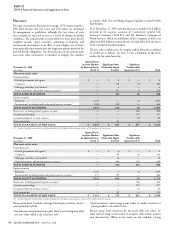
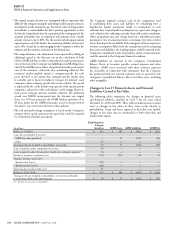
Discount rates are set by applying actual annualized yields at various
durations from the Citigroup Pension Liability curve, without
adjustment, to the expected cash fl ows of the postretirement benefi ts
liabilities. e Company believes that the Citigroup Pension Liability
curve is the most representative curve to use because it is derived from
a broad array of bonds in various industries throughout the domestic
market for high quality bonds. Further, Citigroup monitors the
bond portfolio to ensure that only high quality issues are included.
Accordingly, the Company does not believe that any adjustment is
required to the Citigroup curve.
Expected long-term rates of return on plan assets were developed
considering actual long-term historical returns, expected long-term
market conditions, plan asset mix and management’s investment
strategy, which includes a signifi cant allocation of domestic and
foreign equity securities. Expected long-term market conditions
take into consideration certain key macroeconomic trends including
expected domestic and foreign GDP growth, employment levels and
infl ation. Based on the Company’s current outlook, the expected
return assumption is considered reasonable. Actual and target
investment allocations are very similar at December 31, 2010.
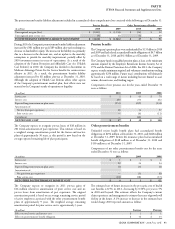
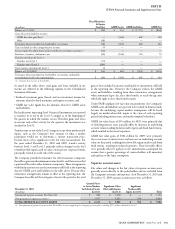
To measure pension costs, the Company uses a market-related asset
valuation for domestic pension plan assets invested in non-fi xed
income investments. e market-related value of pension assets
recognizes the diff erence between actual and expected long-term
returns in the portfolio over 5 years , a method that reduces the short-
term impact of market fl uctuations. At December 31, 2010, the
market-related asset value was approximately $3.4 billion compared
with a market value of approximately $3.2 billion.
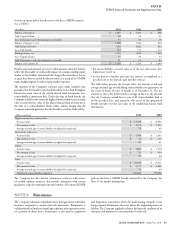
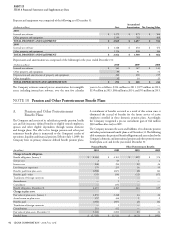
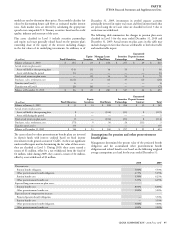
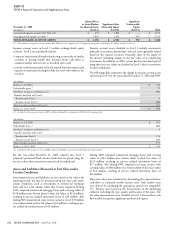
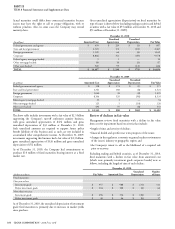
Benefi t payments
e following benefi t payments, including expected future services,
are expected to be paid in:
(In millions)
Pension Bene ts
Other Postretirement Bene ts
Gross Net of Medicare
PartD Subsidy
2011 $ 507 $ 45 $ 41
2012 $ 342 $ 42 $ 40
2013 $ 328 $ 42 $ 40
2014 $ 332 $ 41 $ 39
2015 $ 321 $ 40 $ 38
2016-2020 $ 1,579 $ 179 $ 172
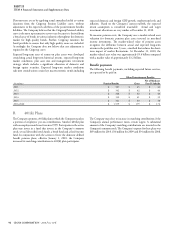
B. 401(k) Plans
e Company sponsors a 401(k) plan in which the Company matches
a portion of employees’ pre-tax contributions. Another 401(k) plan
with an employer match was frozen in 1999. Participants in the active
plan may invest in a fund that invests in the Company’s common
stock, several diversifi ed stock funds, a bond fund and a fi xed-income
fund. In conjunction with the action to freeze the domestic defi ned
benefi t pension plans, eff ective January 1, 2010, the Company
increased its matching contributions to 401(k) plan participants.
e Company may elect to increase its matching contributions if the
Company’s annual performance meets certain targets. A substantial
amount of the Company’s matching contributions are invested in the
Company’s common stock. e Company’s expense for these plans was
$69 million for 2010, $36 million for 2009 and $34 million for 2008.