Cigna 2010 Annual Report Download - page 52
Download and view the complete annual report
Please find page 52 of the 2010 Cigna annual report below. You can navigate through the pages in the report by either clicking on the pages listed below, or by using the keyword search tool below to find specific information within the annual report.-
 1
1 -
2
-
3
-
4
-
5
-
6
-
7
-
8
-
9
-
10
-
11
-
12
-
13
-
14
-
15
-
16
-
17
-
18
-
19
-
20
-
21
-
22
-
23
-
24
-
25
-
26
-
27
-
28
-
29
-
30
-
31
-
32
-
33
-
34
-
35
-
36
-
37
-
38
-
39
-
40
-
41
-
 42
42 -
 43
43 -
 44
44 -
 45
45 -
 46
46 -
 47
47 -
 48
48 -
 49
49 -
 50
50 -
 51
51 -
 52
52 -
 53
53 -
 54
54 -
 55
55 -
 56
56 -
 57
57 -
 58
58 -
 59
59 -
 60
60 -
 61
61 -
 62
62 -
63
-
64
-
65
-
66
-
67
-
68
-
69
-
70
-
71
-
72
-
73
-
74
-
75
-
76
-
77
-
78
-
79
-
80
-
81
-
82
-
83
-
84
-
85
-
86
-
87
-
88
-
89
-
90
-
91
-
92
-
93
-
94
-
95
-
96
-
97
-
98
-
99
-
100
-
101
-
102
-
103
-
104
-
105
-
106
-
107
-
108
-
109
-
110
-
111
-
112
-
113
-
114
-
115
-
116
-
117
-
118
-
119
-
120
-
121
-
122
-
123
-
124
-
125
-
126
-
127
-
128
-
129
-
130
-
131
-
132
-
133
-
134
-
135
-
136
-
137
-
138
-
139
-
140
-
141
-
142
-
143
-
144
-
145
-
146
-
147
-
148
-
149
-
150
-
151
-
152
-
153
-
154
-
155
-
156
-
157
-
158
-
159
-
160
-
161
-
162
-
163
-
164
-
165
-
166
-
167
-
168
-
169
-
170
-
171
-
172
 |
 |

CIGNA CORPORATION 2010 Form 10K
32
PART II
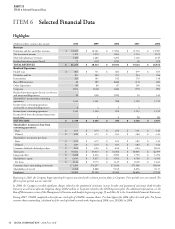
ITEM 6 Selected Financial Data
ITEM 6 Selected Financial Data
Highlights
(Dollars in millions, except per share amounts)
2010 2009 2008 2007 2006
Revenues
Premiums and fees and other revenues $ 18,653 $ 16,161 $ 17,004 $ 15,376 $ 13,987
Net investment income 1,105 1,014 1,063 1,114 1,195
Mail order pharmacy revenues 1,420 1,282 1,204 1,118 1,145
Realized investment gains (losses) 75 (43) (170) 16 219
TOTAL REVENUES $ 21,253 $ 18,414 $ 19,101 $ 17,624 $ 16,546
Results of Operations:
Health Care $ 861 $ 731 $ 664 $ 679 $ 653
Disability and Life 291 284 273 254 226
International 243 183 182 176 138
Run-off Reinsurance 26 185 (646) (11) (14)
Other Operations 85 86 87 109 106
Corporate (211) (142) (162) (97) (95)
Realized investment gains (losses), net of taxes
and noncontrolling interest 50 (26) (110) 10 145
Shareholders’ income from continuing
operations 1,345 1,301 288 1,120 1,159
Income from continuing operations
attributable to noncontrolling interest 4323 -
Income from continuing operations 1,349 1,304 290 1,123 1,159
Income (loss) from discontinued operations,
net of taxes - 1 4 (5) (4)
NET INCOME $ 1,349 $ 1,305 $ 294 $ 1,118 $ 1,155
Shareholders’ income per share from
continuing operations:
Basic $ 4.93 $ 4.75 $ 1.04 $ 3.91 $ 3.46
Diluted $ 4.89 $ 4.73 $ 1.03 $ 3.86 $ 3.43
Shareholders’ net income per share:
Basic $ 4.93 $ 4.75 $ 1.05 $ 3.89 $ 3.45
Diluted $ 4.89 $ 4.73 $ 1.05 $ 3.84 $ 3.42
Common dividends declared per share $ 0.04 $ 0.04 $ 0.04 $ 0.04 $0.03
Total assets $ 45,682 $ 43,013 $ 41,406 $ 40,065 $ 42,399
Long-term debt $ 2,288 $ 2,436 $ 2,090 $ 1,790 $ 1,294
Shareholders’ equity $ 6,645 $ 5,417 $ 3,592 $ 4,748 $ 4,330
Per share $ 24.44 $ 19.75 $ 13.25 $ 16.98 $ 14.63
Common shares outstanding (in thousands) 271,880 274,257 271,036 279,588 98,654
Shareholders of record 8,568 8,888 9,014 8,696 9,117
Employees 30,600 29,300 30,300 26,600 27,100
Beginning in 2010, the Company began reporting the expense associated with its frozen pension plans in Corporate. Prior periods were not restated. e
eff ect on prior periods was not material.
In 2008, the Company recorded signifi cant charges related to the guaranteed minimum income benefi ts and guaranteed minimum death benefi ts
businesses as well as an after-tax litigation charge of $52 million in Corporate related to the CIGNA pension plan. For additional information, see the
Run-off Reinsurance section of the Management’s Discussion and Analysis beginning on page 55 and Note 24 to the Consolidated Financial Statements.
During 2007, CIGNA completed a three-for-one stock split of CIGNA’s common shares. Per share fi gures for 2006 refl ect the stock split. Pro forma
common shares outstanding, calculated as if the stock split had occurred at the beginning of 2006, were 295,963 in 2006.