Cigna 2010 Annual Report Download - page 124
Download and view the complete annual report
Please find page 124 of the 2010 Cigna annual report below. You can navigate through the pages in the report by either clicking on the pages listed below, or by using the keyword search tool below to find specific information within the annual report.-
 1
1 -
2
-
3
-
4
-
5
-
6
-
7
-
8
-
9
-
10
-
11
-
12
-
13
-
14
-
15
-
16
-
17
-
18
-
19
-
20
-
21
-
22
-
23
-
24
-
25
-
26
-
27
-
28
-
29
-
30
-
31
-
32
-
33
-
34
-
35
-
36
-
37
-
38
-
39
-
40
-
41
-
42
-
43
-
44
-
45
-
46
-
47
-
48
-
49
-
50
-
51
-
52
-
53
-
54
-
55
-
56
-
57
-
58
-
59
-
60
-
61
-
62
-
63
-
64
-
65
-
66
-
67
-
68
-
69
-
70
-
71
-
72
-
73
-
74
-
75
-
76
-
77
-
78
-
79
-
80
-
81
-
82
-
83
-
84
-
85
-
86
-
87
-
88
-
89
-
90
-
91
-
92
-
93
-
94
-
95
-
96
-
97
-
98
-
99
-
100
-
101
-
102
-
103
-
104
-
105
-
106
-
107
-
108
-
109
-
110
-
111
-
112
-
113
-
 114
114 -
 115
115 -
 116
116 -
 117
117 -
 118
118 -
 119
119 -
 120
120 -
 121
121 -
 122
122 -
 123
123 -
 124
124 -
 125
125 -
 126
126 -
 127
127 -
 128
128 -
 129
129 -
 130
130 -
 131
131 -
 132
132 -
 133
133 -
 134
134 -
135
-
136
-
137
-
138
-
139
-
140
-
141
-
142
-
143
-
144
-
145
-
146
-
147
-
148
-
149
-
150
-
151
-
152
-
153
-
154
-
155
-
156
-
157
-
158
-
159
-
160
-
161
-
162
-
163
-
164
-
165
-
166
-
167
-
168
-
169
-
170
-
171
-
172
 |
 |

CIGNA CORPORATION 2010 Form 10K
104
PART II
ITEM 8 Financial Statements and Supplementary Data
Actual maturities could diff er from contractual maturities because
issuers may have the right to call or prepay obligations, with or
without penalties. Also, in some cases the Company may extend
maturity dates.
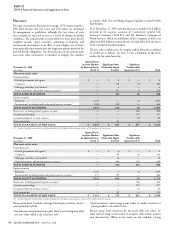
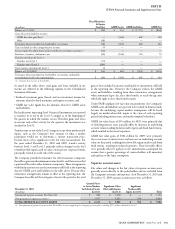
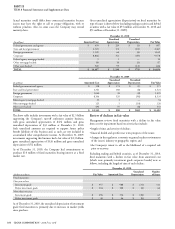
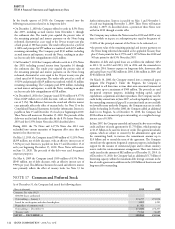
Gross unrealized appreciation (depreciation) on fi xed maturities by
type of issuer is shown below (excluding trading securities and hybrid
securities with a fair value of $55 million at December 31, 2010 and
$51 million at December 31, 2009).
(In millions)
December31,2010
Amortized Cost Unrealized
Appreciation Unrealized
Depreciation Fair Value
Federal government and agency $ 459 $ 229 $ (1) $ 687
State and local government 2,305 172 (10) 2,467
Foreign government 1,109 64 (4) 1,169
Corporate 8,866 761 (49) 9,578
Federal agency mortgage-backed 9 1 — 10
Other mortgage-backed 80 10 (3) 87
Other asset-backed 569 99 (12) 656
TOTAL $ 13,397 $ 1,336 $ 79 $ 14,654
(In millions)
December31,2009
Amortized Cost Unrealized
Appreciation Unrealized
Depreciation Fair Value
Federal government and agency $ 398 $ 174 $ (1) $ 571
State and local government 2,341 188 (8) 2,521
Foreign government 1,040 38 (8) 1,070
Corporate 8,104 529 (98) 8,535
Federal agency mortgage-backed 33 1 — 34
Other mortgage-backed 125 5 (10) 120
Other asset-backed 494 55 (8) 541
TOTAL $ 12,535 $ 990 $ 133 $ 13,392
e above table includes investments with a fair value of $2.5 billion
supporting the Company’s run-off settlement annuity business,
with gross unrealized appreciation of $476 million and gross
unrealized depreciation of $33 million at December 31, 2010.
Such unrealized amounts are required to support future policy
benefi t liabilities of this business and, as such, are not included in
accumulated other comprehensive income. At December 31, 2009,
investments supporting this business had a fair value of $2.3 billion,
gross unrealized appreciation of $326 million and gross unrealized
depreciation of $52 million.
As of December 31, 2010, the Company had commitments to
purchase $14 million of fi xed maturities bearing interest at a fi xed
market rate.
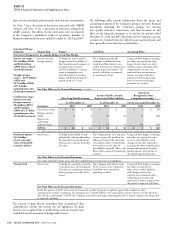
Review of declines in fair value
Management reviews fi xed maturities with a decline in fair value
from cost for impairment based on criteria that include:
•length of time and severity of decline;
•fi nancial health and specifi c near term prospects of the issuer;
•changes in the regulatory, economic or general market environment
of the issuer’s industry or geographic region; and
•the Company’s intent to sell or the likelihood of a required sale
prior to recovery.
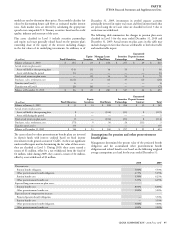
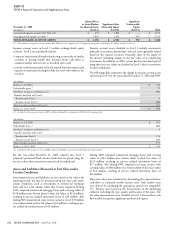
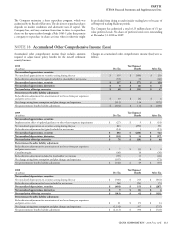
Excluding trading and hybrid securities, as of December 31, 2010,
fi xed maturities with a decline in fair value from amortized cost
(which were primarily investment grade corporate bonds) were as
follows, including the length of time of such decline:
(Dollars in millions)
December31,2010
Fair Value Amortized Cost Unrealized
Depreciation Number
ofIssues
Fixed maturities:
One year or less:
Investment grade $ 957 $ 988 $ (31) 311
Below investment grade $ 104 $ 108 $ (4) 64
More than one year:
Investment grade $ 296 $ 334 $ (38) 63
Below investment grade $ 40 $ 46 $ (6) 17
As of December 31, 2010, the unrealized depreciation of investment
grade fi xed maturities is primarily due to increases in market yields
since purchase.