Cigna 2010 Annual Report Download - page 72
Download and view the complete annual report
Please find page 72 of the 2010 Cigna annual report below. You can navigate through the pages in the report by either clicking on the pages listed below, or by using the keyword search tool below to find specific information within the annual report.-
 1
1 -
2
-
3
-
4
-
5
-
6
-
7
-
8
-
9
-
10
-
11
-
12
-
13
-
14
-
15
-
16
-
17
-
18
-
19
-
20
-
21
-
22
-
23
-
24
-
25
-
26
-
27
-
28
-
29
-
30
-
31
-
32
-
33
-
34
-
35
-
36
-
37
-
38
-
39
-
40
-
41
-
42
-
43
-
44
-
45
-
46
-
47
-
48
-
49
-
50
-
51
-
52
-
53
-
54
-
55
-
56
-
57
-
58
-
59
-
60
-
61
-
 62
62 -
 63
63 -
 64
64 -
 65
65 -
 66
66 -
 67
67 -
 68
68 -
 69
69 -
 70
70 -
 71
71 -
 72
72 -
 73
73 -
 74
74 -
 75
75 -
 76
76 -
 77
77 -
 78
78 -
 79
79 -
 80
80 -
 81
81 -
 82
82 -
83
-
84
-
85
-
86
-
87
-
88
-
89
-
90
-
91
-
92
-
93
-
94
-
95
-
96
-
97
-
98
-
99
-
100
-
101
-
102
-
103
-
104
-
105
-
106
-
107
-
108
-
109
-
110
-
111
-
112
-
113
-
114
-
115
-
116
-
117
-
118
-
119
-
120
-
121
-
122
-
123
-
124
-
125
-
126
-
127
-
128
-
129
-
130
-
131
-
132
-
133
-
134
-
135
-
136
-
137
-
138
-
139
-
140
-
141
-
142
-
143
-
144
-
145
-
146
-
147
-
148
-
149
-
150
-
151
-
152
-
153
-
154
-
155
-
156
-
157
-
158
-
159
-
160
-
161
-
162
-
163
-
164
-
165
-
166
-
167
-
168
-
169
-
170
-
171
-
172
 |
 |

CIGNA CORPORATION 2010 Form 10K
52
PART II
ITEM 7 Management’s Discussion and Analysis of Financial Condition and Results of Operations
enterprise strategy. Within the Health care segment, the Company is
focused on driving operating effi ciency within its primary operating
functions while investing prudently in technology, segment expansion
and specialty products expense.
e Health Care segment’s operating expenses are comprised of three
components and are approximately allocated as follows: health care
(70%), specialty and market segment expansion (20%), and premium
taxes and commissions (10%).
• e health care component is the primary focus of improving
operating expense effi ciency. is component includes:
–fulfi llment activities, which are comprised of service operations,
technology, and medical and network management;
–customer acquisition, which represent costs for sales and
account management, underwriting, and marketing and product
development; and
–staff functions, which represent fi nance, legal and human
resources.
• e specialty and market segment expansion and the premium
tax/commission expense components would increase over time as
revenues grow. Specialty includes disease management, pharmacy,
dental, behavioral, and seniors coverages.
e Health Care segment expects to drive effi ciencies and competitively
manage its operating expenses while remaining focused on its other
business strategies including investing in areas that are critical to
the Company’s growth initiatives and segment expansions, ensuring
continued excellence in customer service and clinical programs, and
leveraging technology to drive further operating effi ciencies.
Disability and Life Segment
Segment Description
e Disability and Life segment includes group disability, life,
accident and specialty insurance.
Key factors for this segment are:
•premium growth, including new business and customer retention;
•net investment income;
•benefi ts expense as a percentage of earned premium (loss ratio); and
•other operating expense as a percentage of earned premiums and
fees (expense ratio).
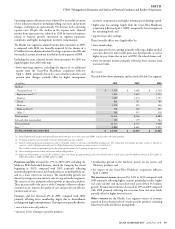
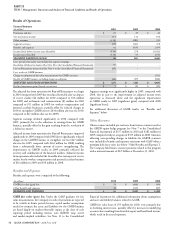
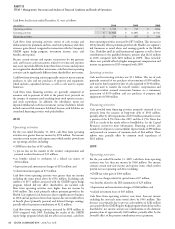
Results of Operations
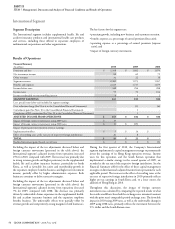
Financial Summary
(In millions)
2010 2009 2008
Premiums and fees $ 2,667 $ 2,634 $ 2,562
Net investment income 261 244 256
Other revenues 123 113 117
Segment revenues 3,051 2,991 2,935
Benefi ts and expenses 2,640 2,598 2,553
Income before taxes 411 393 382
Income taxes 120 109 109
SEGMENT EARNINGS 291 284 273
Less: special items (after-tax) included in segment earnings:
Curtailment gain (See Note 10 to the Consolidated Financial Statements) - 4 -
Cost reduction charge (See Note 6 to the Consolidated Financial Statements) - (4) (2)
Completion of IRS examination (See Note 20 to the Consolidated Financial Statements) - 5 -
ADJUSTED INCOME FROM OPERATIONS $ 291 $ 279 $ 275
Realized investment gains (losses), net of taxes $ 12 $ (1) $ (48)
e Disability and Life segment’s adjusted income from operations
increased 4% in 2010 compared to 2009 refl ecting:
•higher net investment income; and
•the $11 million after-tax gain on the sale of the workers’
compensation and case management business.
Largely off setting these factors were:
•less favorable claims experience in the disability insurance business,
primarily related to lower short-term disability underwriting
margins. ese results include the favorable after-tax impact of
disability reserve studies of $29 million in 2010 compared with
$20 million in 2009, which refl ect continued strong disability
claims management programs;
•slightly less favorable accident claims experience including the less
favorable after-tax impact of reserve studies of $3 million in 2010
compared with $5 million in 2009; and
•lower earnings in specialty products.
e Disability and Life segment’s adjusted income from operations
increased 1% in 2009 compared to 2008 refl ecting:
•favorable claims experience in the disability insurance business
including the favorable after-tax impact of disability reserve studies
of $20 million in 2009 compared with $8 million in 2008. e
results in 2008 also included a $3 million favorable after-tax
impact of a reinsurance settlement. e favorable claims experience
and reserve study impacts are largely driven by continued strong
disability claims management programs;
•improved claims experience in the accident business including the
more favorable after-tax impact of reserve studies of $5 million in
2009 compared with $3 million in 2008; and
•higher premiums and fees in the disability and life businesses.