Cigna 2010 Annual Report Download - page 117
Download and view the complete annual report
Please find page 117 of the 2010 Cigna annual report below. You can navigate through the pages in the report by either clicking on the pages listed below, or by using the keyword search tool below to find specific information within the annual report.-
 1
1 -
2
-
3
-
4
-
5
-
6
-
7
-
8
-
9
-
10
-
11
-
12
-
13
-
14
-
15
-
16
-
17
-
18
-
19
-
20
-
21
-
22
-
23
-
24
-
25
-
26
-
27
-
28
-
29
-
30
-
31
-
32
-
33
-
34
-
35
-
36
-
37
-
38
-
39
-
40
-
41
-
42
-
43
-
44
-
45
-
46
-
47
-
48
-
49
-
50
-
51
-
52
-
53
-
54
-
55
-
56
-
57
-
58
-
59
-
60
-
61
-
62
-
63
-
64
-
65
-
66
-
67
-
68
-
69
-
70
-
71
-
72
-
73
-
74
-
75
-
76
-
77
-
78
-
79
-
80
-
81
-
82
-
83
-
84
-
85
-
86
-
87
-
88
-
89
-
90
-
91
-
92
-
93
-
94
-
95
-
96
-
97
-
98
-
99
-
100
-
101
-
102
-
103
-
104
-
105
-
106
-
 107
107 -
 108
108 -
 109
109 -
 110
110 -
 111
111 -
 112
112 -
 113
113 -
 114
114 -
 115
115 -
 116
116 -
 117
117 -
 118
118 -
 119
119 -
 120
120 -
 121
121 -
 122
122 -
 123
123 -
 124
124 -
 125
125 -
 126
126 -
 127
127 -
128
-
129
-
130
-
131
-
132
-
133
-
134
-
135
-
136
-
137
-
138
-
139
-
140
-
141
-
142
-
143
-
144
-
145
-
146
-
147
-
148
-
149
-
150
-
151
-
152
-
153
-
154
-
155
-
156
-
157
-
158
-
159
-
160
-
161
-
162
-
163
-
164
-
165
-
166
-
167
-
168
-
169
-
170
-
171
-
172
 |
 |
CIGNA CORPORATION 2010 Form 10K 97
PART II
ITEM 8 Financial Statements and Supplementary Data
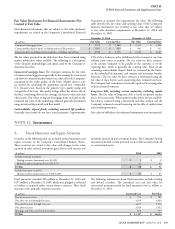
NOTE 11 Fair Value Measurements
e Company carries certain fi nancial instruments at fair value in the
fi nancial statements including fi xed maturities, equity securities, short-
term investments and derivatives. Other fi nancial instruments are
measured at fair value under certain conditions, such as when impaired.
Fair value is defi ned as the price at which an asset could be exchanged
in an orderly transaction between market participants at the balance
sheet date. A liability’s fair value is defi ned as the amount that would
be paid to transfer the liability to a market participant, not the
amount that would be paid to settle the liability with the creditor.
Fair values are based on quoted market prices when available. When
market prices are not available, fair value is generally estimated using
discounted cash fl ow analyses, incorporating current market inputs
for similar fi nancial instruments with comparable terms and credit
quality. In instances where there is little or no market activity for
the same or similar instruments, the Company estimates fair value
using methods, models and assumptions that the Company believes
a hypothetical market participant would use to determine a current
transaction price. ese valuation techniques involve some level of
estimation and judgment by the Company which becomes signifi cant
with increasingly complex instruments or pricing models.
e Company’s fi nancial assets and liabilities carried at fair value
have been classifi ed based upon a hierarchy defi ned by GAAP. e
hierarchy gives the highest ranking to fair values determined using
unadjusted quoted prices in active markets for identical assets and
liabilities (Level 1) and the lowest ranking to fair values determined
using methodologies and models with unobservable inputs (Level 3).
An asset’s or a liability’s classifi cation is based on the lowest level of
input that is signifi cant to its measurement. For example, a fi nancial
asset or liability carried at fair value would be classifi ed in Level 3 if
unobservable inputs were signifi cant to the instrument’s fair value,
even though the measurement may be derived using inputs that are
both observable (Levels 1 and 2) and unobservable (Level 3).
e Company performs ongoing analyses of prices used to value
the Company’s invested assets to determine that they represent
appropriate estimates of fair value. is process involves quantitative
and qualitative analysis including reviews of pricing methodologies,
judgments of valuation inputs, the signifi cance of any unobservable
inputs, pricing statistics and trends. e Company also performs sample
testing of sales values to confi rm the accuracy of prior fair value estimates.
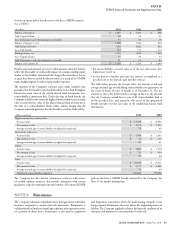
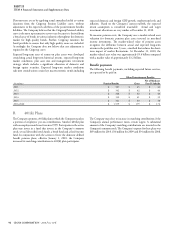
Financial Assets and Financial Liabilities Carried
at Fair Value
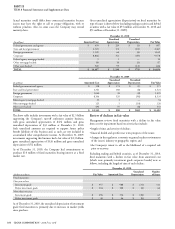
e following tables provide information as of December 31, 2010 and
December 31, 2009 about the Company’s fi nancial assets and liabilities
carried at fair value. Similar disclosures for separate account assets, which
are also recorded at fair value on the Company’s Consolidated Balance
Sheets, are provided separately as gains and losses related to these assets
generally accrue directly to policyholders. In addition, Note 10 contains
similar disclosures for the Company’s pension plan assets.
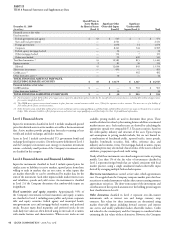
December31,2010
(In millions)
Quoted Prices
inActive Markets
for Identical Assets
(Level1)
Signi cant Other
Observable Inputs
(Level2)
Signi cant
Unobservable
Inputs
(Level3) Total
Financial assets at fair value:
Fixed maturities:
Federal government and agency $ 133 $ 550 $ 4 $ 687
State and local government — 2,467 — 2,467
Foreign government — 1,152 17 1,169
Corporate — 9,252 380 9,632
Federal agency mortgage-backed — 10 — 10
Other mortgage-backed — 85 3 88
Other asset-backed — 161 495 656
Total fi xed maturities (1) 133 13,677 899 14,709
Equity securities 6 87 34 127
Subtotal 139 13,764 933 14,836
Short-term investments — 174 — 174
GMIB assets (2) — — 480 480
Other derivative assets (3) —19—19
TOTAL FINANCIAL ASSETS AT FAIR VALUE,
EXCLUDINGSEPARATE ACCOUNTS $ 139 $ 13,957 $ 1,413 $ 15,509
Financial liabilities at fair value:
GMIB liabilities $ — $ — $ 903 $ 903
Other derivative liabilities (3) —32—32
TOTAL FINANCIAL LIABILITIES AT FAIR VALUE $ $ 32 $ 903 $ 935
(1) Fixed maturities include $443 million of net appreciation required to adjust future policy benefits for the run-off settlement annuity business including $74 million of appreciation for
securities classified in Level 3.
(2) The GMIB assets represent retrocessional contracts in place from two external reinsurers which cover 55% of the exposures on these contracts. The assets are net of a liability of $15 million
for the future cost of reinsurance.
(3) Other derivative assets include $16 million of interest rate and foreign currency swaps qualifying as cash flow hedges and $3 million of interest rate swaps not designated as accounting
hedges. Other derivative liabilities reflect foreign currency and interest rate swaps qualifying as cash flow hedges. See Note 13 for additional information.