Cigna 2010 Annual Report Download - page 68
Download and view the complete annual report
Please find page 68 of the 2010 Cigna annual report below. You can navigate through the pages in the report by either clicking on the pages listed below, or by using the keyword search tool below to find specific information within the annual report.-
 1
1 -
2
-
3
-
4
-
5
-
6
-
7
-
8
-
9
-
10
-
11
-
12
-
13
-
14
-
15
-
16
-
17
-
18
-
19
-
20
-
21
-
22
-
23
-
24
-
25
-
26
-
27
-
28
-
29
-
30
-
31
-
32
-
33
-
34
-
35
-
36
-
37
-
38
-
39
-
40
-
41
-
42
-
43
-
44
-
45
-
46
-
47
-
48
-
49
-
50
-
51
-
52
-
53
-
54
-
55
-
56
-
57
-
 58
58 -
 59
59 -
 60
60 -
 61
61 -
 62
62 -
 63
63 -
 64
64 -
 65
65 -
 66
66 -
 67
67 -
 68
68 -
 69
69 -
 70
70 -
 71
71 -
 72
72 -
 73
73 -
 74
74 -
 75
75 -
 76
76 -
 77
77 -
 78
78 -
79
-
80
-
81
-
82
-
83
-
84
-
85
-
86
-
87
-
88
-
89
-
90
-
91
-
92
-
93
-
94
-
95
-
96
-
97
-
98
-
99
-
100
-
101
-
102
-
103
-
104
-
105
-
106
-
107
-
108
-
109
-
110
-
111
-
112
-
113
-
114
-
115
-
116
-
117
-
118
-
119
-
120
-
121
-
122
-
123
-
124
-
125
-
126
-
127
-
128
-
129
-
130
-
131
-
132
-
133
-
134
-
135
-
136
-
137
-
138
-
139
-
140
-
141
-
142
-
143
-
144
-
145
-
146
-
147
-
148
-
149
-
150
-
151
-
152
-
153
-
154
-
155
-
156
-
157
-
158
-
159
-
160
-
161
-
162
-
163
-
164
-
165
-
166
-
167
-
168
-
169
-
170
-
171
-
172
 |
 |

CIGNA CORPORATION 2010 Form 10K
48
PART II
ITEM 7 Management’s Discussion and Analysis of Financial Condition and Results of Operations
Segment Reporting
Operating segments generally refl ect groups of related products,
but the International segment is generally based on geography. e
Company measures the fi nancial results of its segments using “segment
earnings (loss)”, which is defi ned as shareholders’ income (loss) from
continuing operations excluding after-tax realized investment gains
and losses. “Adjusted income from operations” for each segment is
defi ned as segment earnings excluding special items and the results of
the Company’s GMIB business. Adjusted income from operations is
another measure of profi tability used by the Company’s management
because it presents the underlying results of operations of the segment
and permits analysis of trends. is measure is not determined in
accordance with GAAP and should not be viewed as a substitute
for the most directly comparable GAAP measure, which is segment
earnings. Each segment provides a reconciliation between segment
earnings and adjusted income from operations.
Beginning in 2010, the Company began reporting the expense
associated with its frozen pension plans in Corporate. Prior periods
were not restated; the eff ect on prior periods is not material.
Health Care Segment
Segment Description
e Health Care segment off ers insured and self-insured medical,
dental, behavioral health, vision, and prescription drug benefi t plans,
health advocacy programs and other products and services that may
be integrated to provide comprehensive health care benefi t programs.
CIGNA HealthCare companies off er these products and services in
all 50 states, the District of Columbia and the U.S. Virgin Islands.
ese products and services are off ered through a variety of funding
arrangements such as guaranteed cost, retrospectively experience-
rated and administrative services only arrangements.
e Company measures the operating eff ectiveness of the Health
Care segment using the following key factors:
•segment earnings and adjusted income from operations;
•membership growth;
•sales of specialty products to core medical customers;
•changes in operating expenses per member; and
•medical expense as a percentage of premiums (medical care ratio) in
the guaranteed cost business.
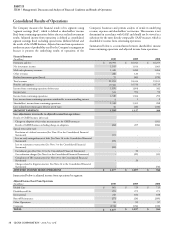
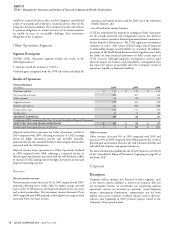
Results of Operations
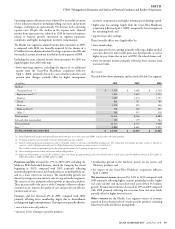
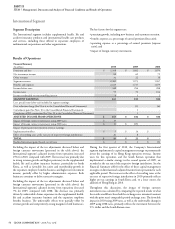
Financial Summary
(In millions)
2010 2009 2008
Premiums and fees $ 13,319 $ 11,384 $ 11,665
Net investment income 243 181 200
Mail order pharmacy revenues 1,420 1,282 1,204
Other revenues 266 262 267
Segment revenues 15,248 13,109 13,336
Mail order pharmacy cost of goods sold 1,169 1,036 961
Benefi ts and other expenses 12,742 10,943 11,359
Benefi ts and expenses 13,911 11,979 12,320
Income before taxes 1,337 1,130 1,016
Income taxes 476 399 352
SEGMENT EARNINGS 861 731 664
Less: special items (after-tax) included in segment earnings:
Curtailment gain (See Note 10 to the Consolidated Financial Statements) - 25 -
Cost reduction charge (See Note 6 to the Consolidated Financial Statements) - (24) (27)
Completion of IRS examination (See Note 20 to the Consolidated Financial
Statements) -1 -
Charge related to litigation matters (See Note 24 to the Consolidated Financial
Statements) - - (24)
ADJUSTED INCOME FROM OPERATIONS $ 861 $ 729 $ 715
Realized investment gains (losses), net of taxes $ 26 $ (19) $ (13)
e Health Care segment’s adjusted income from operations
increased 18% in 2010, as compared with 2009 refl ecting:
•revenue growth in the commercial risk businesses, particularly in
the targeted market segments, as evidenced by a 15% increase in
commercial risk membership. In addition, adjusted income from
operations was favorably impacted by increased penetration of our
specialty products;
•a lower guaranteed cost medical care ratio driven by lower medical
cost trend, refl ecting lower utilization levels, as well as favorable prior
year development; and
•higher investment income due to higher security partnership
results, higher real estate income and increased assets driven by
membership growth.