Cigna 2010 Annual Report Download - page 85
Download and view the complete annual report
Please find page 85 of the 2010 Cigna annual report below. You can navigate through the pages in the report by either clicking on the pages listed below, or by using the keyword search tool below to find specific information within the annual report.-
 1
1 -
2
-
3
-
4
-
5
-
6
-
7
-
8
-
9
-
10
-
11
-
12
-
13
-
14
-
15
-
16
-
17
-
18
-
19
-
20
-
21
-
22
-
23
-
24
-
25
-
26
-
27
-
28
-
29
-
30
-
31
-
32
-
33
-
34
-
35
-
36
-
37
-
38
-
39
-
40
-
41
-
42
-
43
-
44
-
45
-
46
-
47
-
48
-
49
-
50
-
51
-
52
-
53
-
54
-
55
-
56
-
57
-
58
-
59
-
60
-
61
-
62
-
63
-
64
-
65
-
66
-
67
-
68
-
69
-
70
-
71
-
72
-
73
-
74
-
 75
75 -
 76
76 -
 77
77 -
 78
78 -
 79
79 -
 80
80 -
 81
81 -
 82
82 -
 83
83 -
 84
84 -
 85
85 -
 86
86 -
 87
87 -
 88
88 -
 89
89 -
 90
90 -
 91
91 -
 92
92 -
 93
93 -
 94
94 -
 95
95 -
96
-
97
-
98
-
99
-
100
-
101
-
102
-
103
-
104
-
105
-
106
-
107
-
108
-
109
-
110
-
111
-
112
-
113
-
114
-
115
-
116
-
117
-
118
-
119
-
120
-
121
-
122
-
123
-
124
-
125
-
126
-
127
-
128
-
129
-
130
-
131
-
132
-
133
-
134
-
135
-
136
-
137
-
138
-
139
-
140
-
141
-
142
-
143
-
144
-
145
-
146
-
147
-
148
-
149
-
150
-
151
-
152
-
153
-
154
-
155
-
156
-
157
-
158
-
159
-
160
-
161
-
162
-
163
-
164
-
165
-
166
-
167
-
168
-
169
-
170
-
171
-
172
 |
 |

CIGNA CORPORATION 2010 Form 10K 65
PART II
ITEM 7 Management’s Discussion and Analysis of Financial Condition and Results of Operations
Investment Assets
e Company’s investment assets do not include separate account
assets. Additional information regarding the Company’s investment
assets and related accounting policies is included in Notes 2, 11, 12,
13, 14, 15 and 18 to the Consolidated Financial Statements.
Fixed Maturities
Investments in fi xed maturities include publicly-traded and privately
placed debt securities, mortgage and other asset-backed securities,
preferred stocks redeemable by the investor, hybrid and trading
securities. Fair values are based on quoted market prices when
available. When market prices are not available, fair value is generally
estimated using discounted cash fl ow analyses, incorporating current
market inputs for similar fi nancial instruments with comparable
terms and credit quality. In instances where there is little or no market
activity for the same or similar instruments, the Company estimates
fair value using methods, models and assumptions that the Company
believes a hypothetical market participant would use to determine a
current transaction price.
e Company performs ongoing analyses of prices used to value
the Company’s invested assets to determine that they represent
appropriate estimates of fair value. is process involves quantitative
and qualitative analysis including reviews of pricing methodologies,
judgments of valuation inputs, the signifi cance of any unobservable
inputs, pricing statistics and trends. e Company also performs
sample testing of sales values to confi rm the accuracy of prior fair
value estimates.
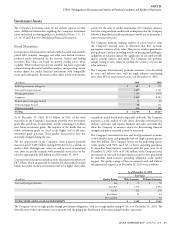
e Company’s fi xed maturity portfolio continues to be diversifi ed
by issuer and industry type, with no single industry constituting
more than 10% of total invested assets as of December 31, 2010.
(In millions)
2010 2009
Federal government and agency $ 687 $ 571
State and local government 2,467 2,521
Foreign government 1,169 1,070
Corporate 9,632 8,585
Federal agency mortgage-backed 10 34
Other mortgage-backed 88 121
Other asset-backed 656 541
TOTAL $ 14,709 $ 13,443
As of December 31, 2010, $13.5 billion, or 92%, of the fi xed
maturities in the Company’s investment portfolio were investment
grade (Baa and above, or equivalent), and the remaining $1.2 billion
were below investment grade. e majority of the bonds that are
below investment grade are rated at the higher end of the non-
investment grade spectrum. ese quality characteristics have not
materially changed during the year.
e net appreciation of the Company’s fi xed maturity portfolio
increased nearly $400 million during 2010, driven by a decline in
market yields. Although asset values are well in excess of amortized
cost, there are specifi c securities with amortized cost in excess of fair
value by approximately $80 million as of December 31, 2010.
Corporate fi xed maturities includes private placement investments of
$4.7 billion, which are generally less marketable than publicly-traded
bonds, but yields on these investments tend to be higher than yields
on publicly-traded bonds with comparable credit risk. e Company
performs a credit analysis of each issuer, diversifi es investments by
industry and issuer and requires fi nancial and other covenants that
allow the Company to monitor issuers for deteriorating fi nancial
strength and pursue remedial actions, if warranted.
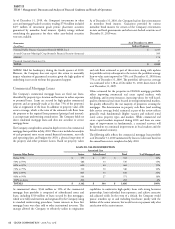
e Company’s investment in state and local government securities
is diversifi ed by issuer and geography with no single exposure greater
than $30 million. e Company focuses on the underlying issuer’s
credit quality with 94% rated A3 or better excluding guarantees
by monoline bond insurers, consistent with the prior year. As of
December 31, 2010, 63%, or $1,542 million, of the Company’s total
investments in state and local government securities were guaranteed
by monoline bond insurers, providing additional credit quality
support. e quality ratings of these investments with and without
this guaranteed support as of December 31, 2010 were as follows:
(In millions)
Quality Rating
As of December31,2010
Fair Value
With Guarantee Without Guarantee
State and local governments Aaa $ 79 $ 78
Aa1-Aa3 1,172 1,092
A1-A3 232 278
Baa1-Baa3 59 42
Not available - 52
TOTAL STATE AND LOCAL GOVERNMENTS $ 1,542 $ 1,542
e Company invests in high quality foreign government obligations, with an average quality rating of AA as of December 31, 2010. e
diversifi cation of these investments was consistent with the geographic distribution of the international business operations.