CVS 2003 Annual Report Download - page 46
Download and view the complete annual report
Please find page 46 of the 2003 CVS annual report below. You can navigate through the pages in the report by either clicking on the pages listed below, or by using the keyword search tool below to find specific information within the annual report.-
 1
1 -
2
-
3
-
4
-
5
-
6
-
7
-
8
-
9
-
10
-
11
-
12
-
13
-
14
-
15
-
16
-
17
-
18
-
19
-
20
-
21
-
22
-
23
-
24
-
25
-
26
-
27
-
28
-
29
-
30
-
31
-
32
-
33
-
34
-
35
-
 36
36 -
 37
37 -
 38
38 -
 39
39 -
 40
40 -
 41
41 -
 42
42 -
 43
43 -
 44
44 -
 45
45 -
 46
46 -
 47
47 -
 48
48 -
 49
49 -
 50
50 -
 51
51 -
 52
52
 |
 |

interest charges). Since these locations will continue to be
operated until closed, any remaining net book value after
the impairment write-down was depreciated over their
revised useful lives. Impairment of the Satellite Facilities
was measured using the “Assets to Be Disposed Of”
provisions of SFAS No. 121, since management intended
to vacate the locations immediately. The entire $3.5 million
net book value of the Satellite Facilities was considered to
be impaired since management intended to discard the
assets located in the facilities. The inventory markdown
resulted from the liquidation of certain front store
inventory contained in the Stores. Since management
intended to liquidate the inventory below its cost, an
adjustment was made to reduce the inventory’s cost to
its net realizable value.
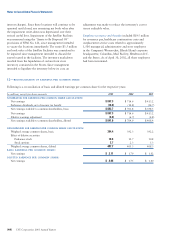
Employee severance and benefits included $19.5 million
for severance pay, healthcare continuation costs and
outplacement service costs related to approximately
1,500 managerial, administrative and store employees
in the Company’s Woonsocket, Rhode Island corporate
headquarters; Columbus, Mail Facility; Henderson D.C.
and the Stores. As of April 30, 2002, all these employees
had been terminated.
Notes to Consolidated Financial Statements
(44) CVS Corporation 2003 Annual Report
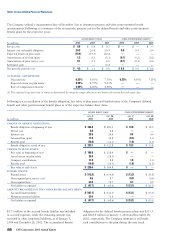
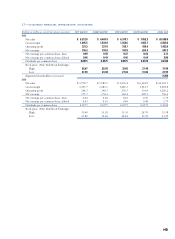
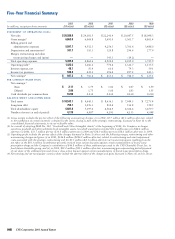
12—RECONCILIATION OF EARNINGS PER COMMON SHARE
Following is a reconciliation of basic and diluted earnings per common share for the respective years:
In millions, except per share amounts 2003 2002 2001
NUMERATOR FOR EARNINGS PER COMMON SHARE CALCULATION:
Net earnings $ 847.3 $ 716.6 $ 413.2
Preference dividends, net of income tax benefit (14.6) (14.8) (14.7)
Net earnings available to common shareholders, basic $ 832.7 $ 701.8 $ 398.5
Net earnings $ 847.3 $ 716.6 $ 413.2
Dilutive earnings adjustment (6.3) (6.7) (4.8)
Net earnings available to common shareholders, diluted $ 841.0 $ 709.9 $ 408.4
DENOMINATOR FOR EARNINGS PER COMMON SHARE CALCULATION:
Weighted average common shares, basic 394.4 392.3 392.2
Effect of dilutive securities:
Preference stock 10.6 10.7 10.8
Stock options 2.7 2.3 5.3
Weighted average common shares, diluted 407.7 405.3 408.3
BASIC EARNINGS PER COMMON SHARE:
Net earnings $ 2.11 $ 1.79 $ 1.02
DILUTED EARNINGS PER COMMON SHARE:
Net earnings $ 2.06 $ 1.75 $ 1.00