CVS 2003 Annual Report Download - page 20
Download and view the complete annual report
Please find page 20 of the 2003 CVS annual report below. You can navigate through the pages in the report by either clicking on the pages listed below, or by using the keyword search tool below to find specific information within the annual report.-
 1
1 -
2
-
3
-
4
-
5
-
6
-
7
-
8
-
9
-
 10
10 -
 11
11 -
 12
12 -
 13
13 -
 14
14 -
 15
15 -
 16
16 -
 17
17 -
 18
18 -
 19
19 -
 20
20 -
 21
21 -
 22
22 -
 23
23 -
 24
24 -
 25
25 -
 26
26 -
 27
27 -
 28
28 -
 29
29 -
 30
30 -
31
-
32
-
33
-
34
-
35
-
36
-
37
-
38
-
39
-
40
-
41
-
42
-
43
-
44
-
45
-
46
-
47
-
48
-
49
-
50
-
51
-
52
 |
 |

(18) CVS Corporation 2003 Annual Report(18) CVS Corporation 2003 Annual Report
The following discussion should be read in conjunction
with our audited consolidated financial statements and
our Cautionary Statement Concerning Forward-Looking
Statements that are presented in this Annual Report.
OUR BUSINESS
Our company is a leader in the retail drugstore industry
in the United States. We sell prescription drugs and
a wide assortment of general merchandise, including
over-the-counter drugs, greeting cards, film and photo
finishing services, beauty products and cosmetics,
seasonal merchandise and convenience foods through
our CVS/pharmacy®retail stores and online through
CVS.com®
. We also provide Pharmacy Benefit Management
and Specialty Pharmacy services through PharmaCare
Management Services. As of January 3, 2004, we operated
4,179 retail and specialty pharmacy stores in 32 states
and the District of Columbia. Please see Note 10 to our
consolidated financial statements for further information
on our business segments.
RESULTS OF OPERATIONS AND INDUSTRY ANALYSIS
The Company’s fiscal year is a 52 or 53 week period
ending on the Saturday nearest to December 31. Fiscal
2003, which ended on January 3, 2004, included 53
weeks. Fiscal 2002 and 2001, which ended on December
28, 2002 and December 29, 2001, respectively, included
52 weeks. Unless otherwise noted, all references to years
relate to these fiscal years.
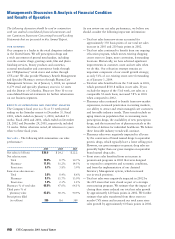
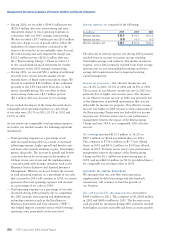
Net sales ~ The following table summarizes our sales
performance:
2003 2002 2001
Net sales (in billions) $ 26.6 $ 24.2 $ 22.2
Net sales increase:
To t a l 10.0% 8.7% 10.7%
Pharmacy 11.9% 11.2% 14.5%
Front store 5.7% 3.8% 3.9%
Same store sales increase:
To t a l 5.8% 8.4% 8.6%
Pharmacy 8.1% 11.7% 13.0%
Front store 1.2% 2.3% 1.2%
Pharmacy % of total sales 68.8% 67.6% 66.1%
Third party % of
pharmacy sales 93.2% 92.3% 90.9%
Prescriptions filled
(in millions) 335 316 309
As you review our net sales performance, we believe you
should consider the following important information:
—Total net sales from new stores accounted for
approximately 350 basis points of our total net sales
increase in 2003 and 210 basis points in 2002.
—Total net sales continued to benefit from our ongoing
relocation program, which moves existing shopping
center stores to larger, more convenient, freestanding
locations. Historically, we have achieved significant
improvements in customer count and net sales when
we do this. Our relocation strategy remains an
important component of our overall growth strategy,
as only 51% of our existing stores were freestanding
as of January 3, 2004.
—Total net sales benefited from the 53rd week in 2003,
which generated $530.8 million in net sales. If you
exclude the impact of the 53rd week, net sales on a
comparable 52-week basis, increased 7.8% in 2003
when compared to 2002.
—Pharmacy sales continued to benefit from new market
expansions, increased penetration in existing markets,
our ability to attract and retain managed care customers
and favorable industry trends. These trends include an
aging American population that is consuming more
prescription drugs, the availability of new prescription
drugs, and the increased use of pharmaceuticals as the
first line of defense for individual healthcare. We believe
these favorable industry trends will continue.
—Pharmacy sales were negatively impacted in all years
by the conversion of brand named drugs to equivalent
generic drugs, which typically have a lower selling price.
However, our gross margins on generic drug sales are
generally higher than our gross margins on equivalent
brand named drug sales.
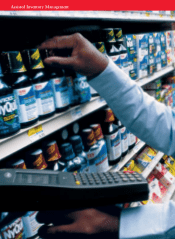
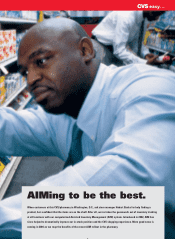
—Front store sales benefited from an increase in
promotional programs in 2002 that were designed
to respond to competitive and economic conditions,
and from the implementation of our Assisted
Inventory Management system, which increased
our in-stock positions.
—Total net sales were negatively impacted in 2002 by
the 229 stores that were closed as part of a strategic
restructuring program. We estimate that the impact of
closing these stores reduced our total net sales growth
by approximately 120 basis points in 2002. We further
estimate that sales transferred from these stores to
nearby CVS stores and increased our total same store
sales growth by approximately 60 basis points in 2002.
Management’s Discussion & Analysis of Financial Condition
and Results of Operation