CVS 2003 Annual Report Download - page 28
Download and view the complete annual report
Please find page 28 of the 2003 CVS annual report below. You can navigate through the pages in the report by either clicking on the pages listed below, or by using the keyword search tool below to find specific information within the annual report.-
 1
1 -
2
-
3
-
4
-
5
-
6
-
7
-
8
-
9
-
10
-
11
-
12
-
13
-
14
-
15
-
16
-
17
-
 18
18 -
 19
19 -
 20
20 -
 21
21 -
 22
22 -
 23
23 -
 24
24 -
 25
25 -
 26
26 -
 27
27 -
 28
28 -
 29
29 -
 30
30 -
 31
31 -
 32
32 -
 33
33 -
 34
34 -
 35
35 -
 36
36 -
 37
37 -
 38
38 -
39
-
40
-
41
-
42
-
43
-
44
-
45
-
46
-
47
-
48
-
49
-
50
-
51
-
52
 |
 |

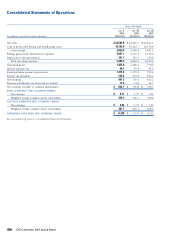
(26) CVS Corporation 2003 Annual Report
FISCAL YEAR ENDED
JAN. 3, DEC. 28, DEC. 29,
2004 2002 2001
In millions, except per share amounts (53 WEEKS)(52 WEEKS)(52 WEEKS)
Net sales $ 26,588.0 $ 24,181.5 $ 22,241.4
Cost of goods sold, buying and warehousing costs 19,725.0 18,112.7 16,550.4
Gross margin 6,863.0 6,068.8 5,691.0
Selling, general and administrative expenses 5,097.7 4,552.3 4,599.6
Depreciation and amortization 341.7 310.3 320.8
To t a l operating expenses 5,439.4 4,862.6 4,920.4
Operating profit 1,423.6 1,206.2 770.6
Interest expense, net 48.1 50.4 61.0
Earnings before income tax provision 1,375.5 1,155.8 709.6
Income tax provision 528.2 439.2 296.4
Net earnings 847.3 716.6 413.2
Preference dividends, net of income tax benefit 14.6 14.8 14.7
Net earnings available to common shareholders $ 832.7 $ 701.8 $ 398.5
BASIC EARNINGS PER COMMON SHARE:
Net earnings $ 2.11 $ 1.79 $ 1.02
Weighted average common shares outstanding 394.4 392.3 392.2
DILUTED EARNINGS PER COMMON SHARE:
Net earnings $ 2.06 $ 1.75 $ 1.00
Weighted average common shares outstanding 407.7 405.3 408.3
DIVIDENDS DECLARED PER COMMON SHARE $ 0.230 $ 0.230 $ 0.230
See accompanying notes to consolidated financial statements.
Consolidated Statements of Operations
(26) CVS Corporation 2003 Annual Report