CVS 2003 Annual Report Download - page 22
Download and view the complete annual report
Please find page 22 of the 2003 CVS annual report below. You can navigate through the pages in the report by either clicking on the pages listed below, or by using the keyword search tool below to find specific information within the annual report.-
 1
1 -
2
-
3
-
4
-
5
-
6
-
7
-
8
-
9
-
10
-
11
-
 12
12 -
 13
13 -
 14
14 -
 15
15 -
 16
16 -
 17
17 -
 18
18 -
 19
19 -
 20
20 -
 21
21 -
 22
22 -
 23
23 -
 24
24 -
 25
25 -
 26
26 -
 27
27 -
 28
28 -
 29
29 -
 30
30 -
 31
31 -
 32
32 -
33
-
34
-
35
-
36
-
37
-
38
-
39
-
40
-
41
-
42
-
43
-
44
-
45
-
46
-
47
-
48
-
49
-
50
-
51
-
52
 |
 |

Management’s Discussion & Analysis of Financial Condition and Results of Operation
(20) CVS Corporation 2003 Annual Report
—During 2001, we recorded a $346.8 million pre-tax
($226.9 million after-tax) restructuring and asset
impairment charge to total operating expenses in
connection with our 2001 strategic restructuring.
We also recorded a $5.7 million pre-tax ($3.6 million
after-tax) charge to cost of goods sold to reflect the
markdown of certain inventory contained in the
stores to be closed to its net realizable value. In total,
the restructuring and asset impairment charge was
$352.5 million pre-tax ($230.5 million after-tax),
the (“Restructuring Charge”). Please see Note 11
to the consolidated financial statements for further
information on the 2001 strategic restructuring.
—During 2001, we received $50.3 million of settlement
proceeds from various lawsuits against certain
manufacturers of brand name prescription drugs. We
elected to contribute $46.8 million of the settlement
proceeds to the CVS Charitable Trust, Inc. to fund
future charitable giving. The net effect of these
nonrecurring items was a $3.5 million pre-tax
($2.1 million after-tax) increase in net earnings.
If you exclude the impact of the items discussed above,
comparable total operating expenses as a percentage
of net sales were 20.5% in 2003, 20.1% in 2002 and
20.4% in 2001.
As you review our comparable total operating expenses,
we believe you should consider the following important
information:
—Total operating expenses as a percentage of net
sales increased during 2003 as a result of increased
advertising expense, higher payroll and benefit costs
and lower sales growth resulting, in part, from higher
generic drug sales. The increase in payroll and benefit
costs were driven by an increase in the number of
24-hour stores, new stores and the implementation
costs associated with strategic initiatives such as the
Pharmacy Service Initiative and Assisted Inventory
Management. Whereas we do not believe the increase
in total operating expenses as a percentage of net sales
that occurred in 2003 will continue in 2004, we cannot
guarantee that total operating expenses will decrease
as a percentage of net sales in 2004.
—Total operating expenses as a percentage of net sales
decreased during 2002 primarily due to completing
the 2001 strategic restructuring and implementing
technology initiatives such as the Excellence in
Pharmacy Innovation and Care initiative (“EPIC”)
that helped improve customer service while lowering
operating costs, particularly at the store level.
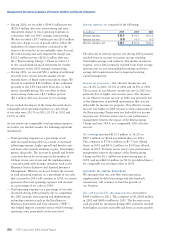
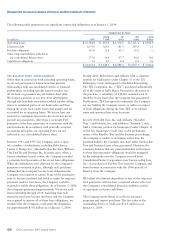
Interest expense, net consisted of the following:
In millions 2003 2002 2001
Interest expense $ 53.9 $ 54.5 $ 65.2
Interest income (5.8) (4.1) (4.2)
Interest expense, net $ 48.1 $ 50.4 $ 61.0
The decrease in interest expense, net during 2003 primarily
resulted from an increase in interest income resulting
from higher average cash balances. The decline in interest
expense, net in 2002 primarily resulted from lower average
interest rates on our outstanding borrowings and lower
average debt requirements due to improved working
capital management.
Income tax provision ~ Our effective income tax rate
was 38.4% in 2003, 38.0% in 2002 and 41.8% in 2001.
The increase in our effective income tax rate in 2003 was
primarily due to higher state income taxes. The decrease
in our effective income tax rate in 2002 was primarily due
to the elimination of goodwill amortization that was not
deductible for income tax purposes. Our effective income
tax rate was higher in 2001 because certain components of
the Restructuring Charge were not deductible for income
tax purposes. To better assess year-to-year performance,
management removes the impact of the Restructuring
Charge and uses 39.4% as a comparable 2001 effective
tax rate.
Net earnings increased $130.7 million or 18.2% to
$847.3 million (or $2.06 per diluted share) in 2003.
This compares to $716.6 million (or $1.75 per diluted
share) in 2002 and $413.2 million (or $1.00 per diluted
share) in 2001. To better assess year-to-year performance,
management removes the impact of the Restructuring
Charge and the $2.1 million net nonrecurring gain in
2001, and uses $641.6 million (or $1.56 per diluted share)
for comparable net earnings results in 2001.
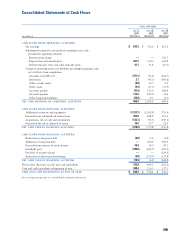
LIQUIDITY & CAPITAL RESOURCES
We anticipate that our cash flow from operations,
supplemented by debt borrowings and sale-leaseback
transactions, will continue to fund the growth of
our business.
Net cash provided by operating activities decreased to
$968.9 million in 2003. This compares to $1,204.8 million
in 2002 and $680.6 million in 2001. The decrease in net
cash provided by operations during 2003 primarily resulted
from higher accounts receivable and lower accounts payable