CVS 2003 Annual Report Download - page 23
Download and view the complete annual report
Please find page 23 of the 2003 CVS annual report below. You can navigate through the pages in the report by either clicking on the pages listed below, or by using the keyword search tool below to find specific information within the annual report.-
 1
1 -
2
-
3
-
4
-
5
-
6
-
7
-
8
-
9
-
10
-
11
-
12
-
 13
13 -
 14
14 -
 15
15 -
 16
16 -
 17
17 -
 18
18 -
 19
19 -
 20
20 -
 21
21 -
 22
22 -
 23
23 -
 24
24 -
 25
25 -
 26
26 -
 27
27 -
 28
28 -
 29
29 -
 30
30 -
 31
31 -
 32
32 -
 33
33 -
34
-
35
-
36
-
37
-
38
-
39
-
40
-
41
-
42
-
43
-
44
-
45
-
46
-
47
-
48
-
49
-
50
-
51
-
52
 |
 |

(21)
offset, in part, by higher net earnings. Accounts receivable
increased in 2003 primarily because our January 3, 2004
year-end ended in the middle of many of our third party
payors’ biweekly payment cycles. Accounts payable
decreased primarily due to the timing of vendor payments.
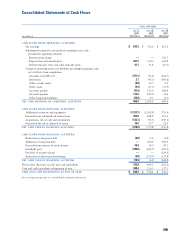
Net cash used in investing activities increased to $753.6
million in 2003. This compares to $735.8 million in 2002
and $536.8 million in 2001. The increase in net cash used
in investing activities during 2003 was primarily due to
acquisitions by our Pharmacy Benefit Management segment
and increased acquisitions of customer lists. Capital
expenditures totaled $1,121.7 million during 2003,
compared to $1,108.8 million in 2002 and $713.6 million
in 2001. During 2003, approximately 60% of our total
capital expenditures were for new store construction,
22% for store expansion and improvements, 14% for
technology and other corporate initiatives and 4% for
a new distribution center in Texas, which is expected
to be completed during the first quarter of 2004.
We financ e a portion of our new store development
program through sale-leaseback transactions. Proceeds
from sale-leaseback transactions totaled $487.8 million
in 2003. This compares to $448.8 million in 2002 and
$323.3 million in 2001. Under the transactions, the
properties are sold at net book value and the resulting
leases qualify and are accounted for as operating leases.
During 2001, we also completed a sale-leaseback
transaction on five of our distribution centers. The
distribution centers were sold at fair market value resulting
in a $35.5 million gain, which was deferred and is being
amortized to offset rent expense over the life of the new
operating leases.
During 2004, we currently plan to invest over $1.1 billion
in capital expenditures, which will include spending for
approximately 225-250 new or relocated stores, including
approximately 100 in new markets.
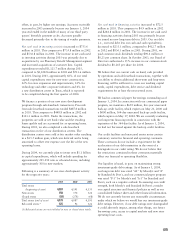
Following is a summary of our store development activity
for the respective years:
2003 2002 2001
To t a l stores
(beginning of year) 4,087 4,191 4,133
New stores 150 174 126
Closed stores (58) (278) (68)
To t a l stores (end of year) 4,179 4,087 4,191
Relocated stores(1) 125 92 122
(1) Relocated stores are not included in new or closed store totals.
Net cash used in financing activities increased to $72.5
million in 2003. This compares to $4.9 million in 2002
and $244.8 million in 2001. The increase in net cash used
in financing activities during 2003 was primarily because
we issued no new long-term debt in 2003. Our net debt
(i.e., our total debt less our cash and cash equivalents),
decreased to $233.1 million, compared to $412.7 million
in 2002 and $836.3 million in 2001. During 2003, we
paid common stock dividends totaling $90.6 million or
$0.23 per common share. In October 2003, our Board of
Directors authorized a 15% increase in our common stock
dividend to $0.265 per share for 2004.
We believe that our current cash on hand, cash provided
by operations and sale-leaseback transactions, together with
our ability to obtain additional short-term and long-term
financing, will be sufficient to cover our working capital
needs, capital expenditures, debt service and dividend
requirements for at least the next several years.
We had no commercial paper borrowings outstanding as of
January 3, 2004. In connection with our commercial paper
program, we maintain a $650 million, five-year unsecured
back-up credit facility, which expires on May 21, 2006 and
a $600 million, 364-day unsecured back-up credit facility,
which expires on May 17, 2004. We are currently evaluating
our long-term financing needs in connection with the
expiration of the 364-day facility. As of January 3, 2004,
we had not borrowed against the back-up credit facilities.
Our credit facilities and unsecured senior notes contain
customary restrictive financial and operating covenants.
These covenants do not include a requirement for the
acceleration of our debt maturities in the event of a
downgrade in our credit rating. We do not believe that
the restrictions contained in these covenants materially
affect our financial or operating flexibility.
Our liquidity is based, in part, on maintaining strong
investment-grade debt ratings. As of January 3, 2004,
our long-term debt was rated “A2” by Moody’s and “A”
by Standard & Poor’s, and our commercial paper program
was rated “P-1” by Moody’s and “A-1” by Standard and
Poor’s, each on a negative outlook. In assessing our credit
strength, both Moody’s and Standard & Poor’s consider
our capital structure and financial policies as well as our
consolidated balance sheet and other financial information.
We do not currently foresee any reasonable circumstances
under which we believe we would lose our investment-grade
debt ratings. However, if our debt ratings were downgraded
it could adversely impact, among other things, our future
borrowing costs, access to capital markets and new store
operating lease costs.
(21)