CVS 2003 Annual Report Download - page 31
Download and view the complete annual report
Please find page 31 of the 2003 CVS annual report below. You can navigate through the pages in the report by either clicking on the pages listed below, or by using the keyword search tool below to find specific information within the annual report.-
 1
1 -
2
-
3
-
4
-
5
-
6
-
7
-
8
-
9
-
10
-
11
-
12
-
13
-
14
-
15
-
16
-
17
-
18
-
19
-
20
-
 21
21 -
 22
22 -
 23
23 -
 24
24 -
 25
25 -
 26
26 -
 27
27 -
 28
28 -
 29
29 -
 30
30 -
 31
31 -
 32
32 -
 33
33 -
 34
34 -
 35
35 -
 36
36 -
 37
37 -
 38
38 -
 39
39 -
 40
40 -
 41
41 -
42
-
43
-
44
-
45
-
46
-
47
-
48
-
49
-
50
-
51
-
52
 |
 |

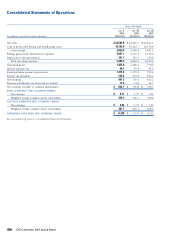
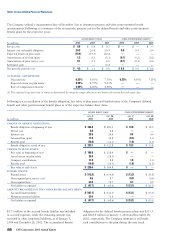
(29)
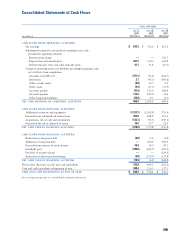
FISCAL YEAR ENDED
JAN. 3, DEC. 28, DEC. 29,
2004 2002 2001
In millions (53 WEEKS)(52 WEEKS)(52 WEEKS)
CASH FLOWS FROM OPERATING ACTIVITIES:
Net earnings $ 847.3 $ 716.6 $ 413.2
Adjustments required to reconcile net earnings to net cash
provided by operating activities:
Restructuring charge ——352.5
Depreciation and amortization 341.7 310.3 320.8
Deferred income taxes and other noncash items 41.1 71.8 (83.5)
Change in operating assets and liabilities providing/(requiring) cash,
net of effects from acquisitions:
Accounts receivable, net (311.1) (53.1) (141.7)
Inventories 2.1 (95.3) (366.8)
Other current assets (3.0) 12.5 4.1
Other assets (0.4) (35.3) (13.9)
Accounts payable (41.5) 172.0 184.4
Accrued expenses 116.5 105.0 11.6
Other long-term liabilities (23.8) 0.3 (0.1)
NET CASH PROVIDED BY OPERATING ACTIVITIES 968.9 1,204.8 680.6
CASH FLOWS FROM INVESTING ACTIVITIES:
Additions to property and equipment (1,121.7) (1,108.8) (713.6)
Proceeds from sale-leaseback transactions 487.8 448.8 323.3
Acquisitions, net of cash and investments (133.1) (93.5) (159.1)
Proceeds from sale or disposal of assets 13.4 17.7 12.6
NET CASH USED IN INVESTING ACTIVITIES (753.6) (735.8) (536.8)
CASH FLOWS FROM FINANCING ACTIVITIES:
Reductions in long-term debt (0.8) (3.1) (1.0)
Additions to long-term debt —300.0 296.9
Proceeds from exercise of stock options 38.3 34.0 47.3
Dividends paid (105.2) (104.9) (105.2)
Purchase of treasury shares ——(129.0)
Reductions in short-term borrowings (4.8) (230.9) (353.8)
NET CASH USED IN FINANCING ACTIVITIES (72.5) (4.9) (244.8)
Net increase (decrease) in cash and cash equivalents 142.8 464.1 (101.0)
Cash and cash equivalents at beginning of year 700.4 236.3 337.3
CASH AND CASH EQUIVALENTS AT END OF YEAR $ 843.2 $ 700.4 $ 236.3
See accompanying notes to consolidated financial statements.
Consolidated Statements of Cash Flows
(29)