CVS 2003 Annual Report Download - page 34
Download and view the complete annual report
Please find page 34 of the 2003 CVS annual report below. You can navigate through the pages in the report by either clicking on the pages listed below, or by using the keyword search tool below to find specific information within the annual report.-
 1
1 -
2
-
3
-
4
-
5
-
6
-
7
-
8
-
9
-
10
-
11
-
12
-
13
-
14
-
15
-
16
-
17
-
18
-
19
-
20
-
21
-
22
-
23
-
 24
24 -
 25
25 -
 26
26 -
 27
27 -
 28
28 -
 29
29 -
 30
30 -
 31
31 -
 32
32 -
 33
33 -
 34
34 -
 35
35 -
 36
36 -
 37
37 -
 38
38 -
 39
39 -
 40
40 -
 41
41 -
 42
42 -
 43
43 -
 44
44 -
45
-
46
-
47
-
48
-
49
-
50
-
51
-
52
 |
 |

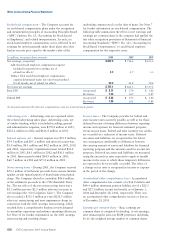
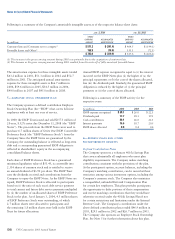
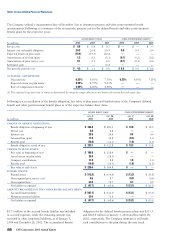
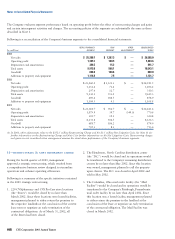
Stock-based compensation ~ The Company accounts for
its stock-based compensation plans under the recognition
and measurement principles of Accounting Principles Board
(“APB”) Opinion No. 25, “Accounting for Stock Issued
to Employees,” and related interpretations. As such, no
stock-based employee compensation cost is reflected in net
earnings for options granted under those plans since they
had an exercise price equal to the market value of the
underlying common stock on the date of grant. See Note 7
for further information on stock-based compensation. The
following table summarizes the effect on net earnings and
earnings per common share if the company had applied the
fair value recognition provisions of Statement of Financial
Accounting Standards (“SFAS”) No. 123, “Accounting for
Stock-Based Compensation,” to stock-based employee
compensation for the respective years:
Notes to Consolidated Financial Statements
(32) CVS Corporation 2003 Annual Report
In millions, except per share amounts 2003 2002 2001
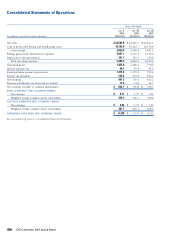
Net earnings, as reported $ 847.3 $ 716.6 $ 413.2
Add: Stock-based employee compensation expense
included in reported net earnings, net of
related tax effects(1) 2.2 2.7 3.3
Deduct: Total stock-based employee compensation
expense determined under fair value based method
for all awards, net of related tax effects 52.4 56.8 59.4
Pro forma net earnings $ 797.1 $ 662.5 $ 357.1
Basic EPS: As reported $ 2.11 $ 1.79 $ 1.02
Pro forma 1.98 1.65 0.87
Diluted EPS: As reported $ 2.06 $ 1.75 $ 1.00
Pro forma 1.95 1.62 0.86
(1) Amounts represent the after-tax compensation costs for restricted stock grants.
Advertising costs ~ Advertising costs are expensed when
the related advertising takes place. Advertising costs, net
of vendor funding, which is included in selling, general
and administrative expenses, were $178.2 million in 2003,
$152.2 million in 2002 and $126.9 million in 2001.
Interest expense, net ~ Interest expense was $53.9 million,
$54.5 million and $65.2 million and interest income was
$5.8 million, $4.1 million and $4.2 million in 2003, 2002
and 2001, respectively. Capitalized interest totaled $11.0
million in 2003, $6.1 million in 2002 and $10.1 million
in 2001. Interest paid totaled $64.9 million in 2003,
$60.7 million in 2002 and $75.2 million in 2001.
Nonrecurring items ~ During 2001, the Company received
$50.3 million of settlement proceeds from various lawsuits
against certain manufacturers of brand name prescription
drugs. The Company elected to contribute $46.8 million
of the settlement proceeds to the CVS Charitable Trust,
Inc. The net effect of the two nonrecurring items was a
$3.5 million pre-tax ($2.1 million after-tax) increase in
net earnings (the “Net Litigation Gain”). The Company
also recorded a $352.5 million pre-tax ($230.5 million
after-tax) restructuring and asset impairment charge in
connection with the 2001 strategic restructuring, which
resulted from a comprehensive business review designed
to streamline operations and enhance operating efficiencies.
See Note 11 for further information on the 2001 strategic
restructuring and resulting charge.
Income taxes ~ The Company provides for federal and
state income taxes currently payable, as well as for those
deferred because of timing differences between reporting
income and expenses for financial statement purposes
versus tax purposes. Federal and state incentive tax credits
are recorded as a reduction of income taxes. Deferred
tax assets and liabilities are recognized for the future
tax consequences attributable to differences between
the carrying amount of assets and liabilities for financial
reporting purposes and the amounts used for income tax
purposes. Deferred tax assets and liabilities are measured
using the enacted tax rates expected to apply to taxable
income in the years in which those temporary differences
are expected to be recoverable or settled. The effect of
a change in tax rates is recognized as income or expense
in the period of the change.
Accumulated other comprehensive loss ~ Accumulated
other comprehensive loss consists of a $36.9 million and
$44.6 million minimum pension liability, net of a $22.5
and $27.3 million income tax benefit, as of January 3,
2004 and December 28, 2002, respectively. There was
no accumulated other comprehensive income or loss as
of December 29, 2001.
Earnings per common share ~ Basic earnings per
common share is computed by dividing: (i) net earnings,
after deducting the after-tax ESOP preference dividends,
by (ii) the weighted average number of common shares