Blackberry 2005 Annual Report Download - page 69
Download and view the complete annual report
Please find page 69 of the 2005 Blackberry annual report below. You can navigate through the pages in the report by either clicking on the pages listed below, or by using the keyword search tool below to find specific information within the annual report.-
 1
1 -
2
-
3
-
4
-
5
-
6
-
7
-
8
-
9
-
10
-
11
-
12
-
13
-
14
-
15
-
16
-
17
-
18
-
19
-
20
-
21
-
22
-
23
-
24
-
25
-
26
-
27
-
28
-
29
-
30
-
31
-
32
-
33
-
34
-
35
-
36
-
37
-
38
-
39
-
40
-
41
-
42
-
43
-
44
-
45
-
46
-
47
-
48
-
49
-
50
-
51
-
52
-
53
-
54
-
55
-
56
-
57
-
58
-
 59
59 -
 60
60 -
 61
61 -
 62
62 -
 63
63 -
 64
64 -
 65
65 -
 66
66 -
 67
67 -
 68
68 -
 69
69 -
 70
70 -
 71
71 -
 72
72 -
 73
73 -
 74
74 -
 75
75 -
 76
76
 |
 |

67
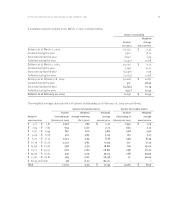
16. Earnings (Loss) Per Share
The following table sets forth the computation of basic and diluted earnings (loss) per share.
For the year ended February 26, 2005 February 28, 2004 March 1, 2003
Numerator for basic and diluted earnings (loss)
per share available to common stockholders $213,387 $51,829 $ (148,857)
Denominator for basic earnings (loss) per share –
weighted average shares outstanding 187,653 159,300 155,272
Effect of dilutive securities:
Employee stock options 8,786 8,080 –
Denominator for basic and diluted earnings (loss)
per share – weighted average shares outstanding 196,439 167,380 155,272
Earnings (loss) per share
Basic $1.14 $0.33 $ (0.96)
Diluted $1.09 $0.31 $ (0.96)
Stock options and common share purchase warrants were excluded from the diluted loss per share figures for
2003, as they were anti-dilutive.
17. Comprehensive Income (Loss)
The components of comprehensive income (loss) are shown in the following table:
For the year ended February 26, 2005 February 28, 2004 March 1, 2003
Net income (loss) $213,387 $51,829 $ (148,857)
Net change in unrealized gains (losses) on
available-for-sale investments (18,357) 1,854 4,158
Net change in derivative fair value during the year,
net of income taxes of $10,429
(February 28, 2004 – $nil; March 1, 2003 – $nil) 8,446 11,941 5,958
Amounts reclassified to earnings during the year,
net of income taxes of $5,359
(February 28, 2004 – $nil; March 1, 2003 – $nil) (4,340) (9,912) (1,041)
Comprehensive income (loss) $199,136 $55,712 $ (139,782)
The components of accumulated other comprehensive income are as follows:
For the year ended February 26, 2005 February 28, 2004 March 1, 2003
Accumulated net unrealized gains (losses)
on available-for-sale investments $(12,345) $6,012 $ 4,158
Accumulated net unrealized gains on
derivative instruments 9,574 5,468 3,439
Total accumulated other comprehensive income (loss) $(2,771) $11,480 $ 7,597
For the years ended February 26, 2005, February 28, 2004 and March 1, 2003