Blackberry 2005 Annual Report Download - page 32
Download and view the complete annual report
Please find page 32 of the 2005 Blackberry annual report below. You can navigate through the pages in the report by either clicking on the pages listed below, or by using the keyword search tool below to find specific information within the annual report.-
 1
1 -
2
-
3
-
4
-
5
-
6
-
7
-
8
-
9
-
10
-
11
-
12
-
13
-
14
-
15
-
16
-
17
-
18
-
19
-
20
-
21
-
 22
22 -
 23
23 -
 24
24 -
 25
25 -
 26
26 -
 27
27 -
 28
28 -
 29
29 -
 30
30 -
 31
31 -
 32
32 -
 33
33 -
 34
34 -
 35
35 -
 36
36 -
 37
37 -
 38
38 -
 39
39 -
 40
40 -
 41
41 -
 42
42 -
43
-
44
-
45
-
46
-
47
-
48
-
49
-
50
-
51
-
52
-
53
-
54
-
55
-
56
-
57
-
58
-
59
-
60
-
61
-
62
-
63
-
64
-
65
-
66
-
67
-
68
-
69
-
70
-
71
-
72
-
73
-
74
-
75
-
76
 |
 |

30
NTP Litigation Matter
During the fourth quarter of fiscal 2005, the Company recorded a provision of $294.2 million to account
for the balance of the resolution amount not previously recorded, plus incremental legal fees. See “Critical
Accounting Policies and Estimates – Litigation”, “Results of Operations – Litigation” and note 15 to the
Consolidated Financial Statements.
Income Taxes
During the fourth quarter of fiscal 2005, the Company recorded a net tax recovery of $144.6 million, compared
to a net tax recovery of $4.2 million in the fourth quarter of fiscal 2004, resulting in an increase in net income
of $140.4 million. See “Critical Accounting Policies and Estimates – Income Litigation”, “Results of Operations
– Income Taxes” and note 9 to the Consolidated Financial Statements.
Net Income
Net loss was $2.6 million, or $0.01 per share basic and diluted, in the fourth quarter of fiscal 2005, compared
to net income of $41.5 million, or $0.24 per share basic and $0.23 per share diluted, in the prior year’s
fourth quarter.
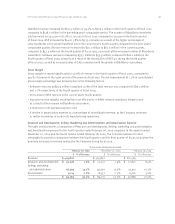
Liquidity and Capital Resources
Cash and cash equivalents, short-term investments and investments increased by $184.0 million to
$1.68 billion as at February 26, 2005 from $1.50 billion as at February 28, 2004. The majority of the Company’s
cash and cash equivalents and investments is denominated in U.S. dollars as at February 26, 2005.
A comparative summary of cash and cash equivalents, short-term investments and investments is set out below:
As at February 26, 2005 February 28, 2004 Change 2005/2004
Cash and cash equivalents $610,354 $1,156,419 $(546,065)
Short-term investments 315,495 –315,495
Investments 753,868 339,285 414,583
Cash, cash equivalents, short-term investments
and investments $1,679,717 $1,495,704 $184,013
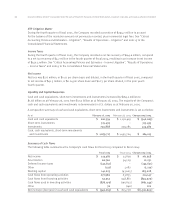
Summary of Cash Flows
The following table summarizes the Company’s cash flows for fiscal 2005 compared to fiscal 2004:
Fiscal 2005 Fiscal 2004 Change 2005/2004
Net income $213,387 $51,829 $161,558
Amortization 66,760 54,529 12,231
Deferred income taxes (143,651) –(143,651)
Other (137) 1,082 (1,219)
Working capital 141,623 (43,605) 185,228
Cash flows from operating activities 277,982 63,835 214,147
Cash flows from financing activities 53,952 948,881 (894,929)
Cash flows used in investing activities (878,075) (196,832) (681,243)
Other 76 (146) 222
Net increase (decrease) in cash and cash equivalents $(546,065) $815,738 $(1,361,803)
Research In Motion Limited •Incorporated Under the Laws of Ontario (In thousands of United States dollars, except per share data, and except as otherwise indicated)