Blackberry 2005 Annual Report Download - page 21
Download and view the complete annual report
Please find page 21 of the 2005 Blackberry annual report below. You can navigate through the pages in the report by either clicking on the pages listed below, or by using the keyword search tool below to find specific information within the annual report.-
 1
1 -
2
-
3
-
4
-
5
-
6
-
7
-
8
-
9
-
10
-
 11
11 -
 12
12 -
 13
13 -
 14
14 -
 15
15 -
 16
16 -
 17
17 -
 18
18 -
 19
19 -
 20
20 -
 21
21 -
 22
22 -
 23
23 -
 24
24 -
 25
25 -
 26
26 -
 27
27 -
 28
28 -
 29
29 -
 30
30 -
 31
31 -
32
-
33
-
34
-
35
-
36
-
37
-
38
-
39
-
40
-
41
-
42
-
43
-
44
-
45
-
46
-
47
-
48
-
49
-
50
-
51
-
52
-
53
-
54
-
55
-
56
-
57
-
58
-
59
-
60
-
61
-
62
-
63
-
64
-
65
-
66
-
67
-
68
-
69
-
70
-
71
-
72
-
73
-
74
-
75
-
76
 |
 |

19
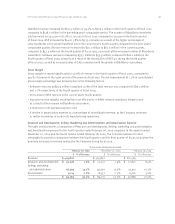
The following table sets forth certain consolidated statement of operations data expressed as a percentage of
revenue for the periods indicated:
Fiscal year ended February 26, 2005 February 28, 2004 Change 2005/2004 March 1, 2003
Revenue 100.0% 100.0% –100.0%
Cost of sales 47.1% 54.4% (7.3%) 61.1%
Gross margin 52.9% 45.6% 7.3% 38.9%
Expenses
Research and development 7.5% 10.5% (3.0%) 18.2%
Selling, marketing and administration 14.1% 18.2% (4.1%) 34.2%
Amortization 2.7% 4.8% (2.1%) 7.3%
Sub-total 24.3% 33.5% (9.2%) 59.7%
Restructuring charges –––2.1%
Litigation 26.1% 5.9% 20.2% 19.0%
Restructuring and litigation 26.1% 5.9% 20.2% 21.1%
50.4% 39.4% 11.0% 80.8%
Income (loss) from operations 2.5% 6.2% (3.7%) (41.9%)
Investment income 2.7% 1.8% 0.9% 3.7%
Income (loss) before income taxes 5.2% 8.0% (2.8%) (38.2%)
Provision for (recovery of) income tax (10.5%) (0.7%) 9.8% 10.3%
Net income (loss) 15.7% 8.7% 7.0% (48.5%)
Executive Summary
As the above tables highlight, the Company experienced significant revenue and earnings growth in fiscal
2005 compared to fiscal 2004. The key factors that contributed to this net improvement are discussed below.
A more comprehensive analysis of these factors is presented in “Results of Operations”.
The Company’s net income increased by $161.6 million to $213.4 million, or $1.14 basic earnings per share
and $1.09 diluted earnings per share in fiscal 2005, compared to net income of $51.8 million, or $0.33 basic
earnings per share and $0.31 diluted earnings per share in fiscal 2004.
Fiscal 2005 Key Factors
Revenue and resulting gross margin growth
Revenue increased by $755.8 million to $1,350.4 million in fiscal 2005 compared to $594.6 million in the
preceding year. The number of BlackBerry handhelds sold increased by 1.52 million units, or 165.7%, to 2.44
million units in fiscal 2005 compared to 0.92 million units in fiscal 2004. Factoring in a 2.4% increase in ASP,
handheld revenues increased by $590.8 million, or 172.2%, to $934.0 million in fiscal 2005. Service revenue
increased by $63.8 million to $235.0 million in fiscal 2005, consistent with the Company’s increase in
BlackBerry relay subscribers during the year. Software revenue increased by $84.4 million to $131.8 million in
fiscal 2005, also consistent with the increase in BlackBerry subscriber base.
Gross margin increased to $714.5 million, or 52.9% of revenue, in fiscal 2005 compared to $271.3 million,
or 45.6% of revenue, in fiscal 2004. The increase of 7.3% in gross margin in fiscal 2005 is primarily
attributable to the Company’s continuing cost reduction efforts for its BlackBerry handhelds and service
revenue streams, increased manufacturing and service delivery cost efficiencies as a result of the increase
in handheld volumes, favorable overall product mix with higher software and NRE revenues in fiscal 2005
and lower net warranty expense.
For the years ended February 26, 2005, February 28, 2004 and March 1, 2003