Blackberry 2005 Annual Report Download - page 20
Download and view the complete annual report
Please find page 20 of the 2005 Blackberry annual report below. You can navigate through the pages in the report by either clicking on the pages listed below, or by using the keyword search tool below to find specific information within the annual report.
18
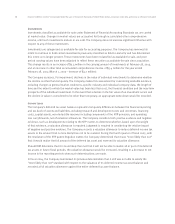
Summary Results of Operations – Fiscal 2005 Compared to Fiscal 2004 and Fiscal 2003
The following table sets forth certain consolidated statement of operations and consolidated balance sheet
data for the periods indicated:
As at and for the fiscal year ended February 26, 2005 February 28, 2004 Change 2005/2004 March 1, 2003
(in thousands, except for per share amounts)
Revenue $1,350,447 $594,616 $755,831 $306,732
Cost of sales 635,914 323,365 312,549 187,289
Gross margin 714,533 271,251 443,282 119,443
Expenses
Research and development 101,180 62,638 38,542 55,916
Selling, marketing and administration 190,730 108,492 82,238 104,978
Amortization 35,941 27,911 8,030 22,324
Sub-total 327,851 199,041 128,810 183,218
Restructuring charges –––6,550
Litigation (1) 352,628 35,187 317,441 58,210
Restructuring and litigation 352,628 35,187 317,441 64,760
680,479 234,228 446,251 247,978
Income (loss) from operations 34,054 37,023 (2,969) (128,535)
Investment income 37,107 10,606 26,501 11,430
Income (loss) before income taxes 71,161 47,629 23,532 (117,105)
Provision for (recovery of) income tax (2) (142,226) (4,200) 138,026 31,752
Net income (loss) $213,387 $51,829 $161,558 $(148,857)
Earnings (loss) per share (3)
Basic $1.14 $0.33 $0.81 $(0.96)
Diluted $1.09 $0.31 $0.78 $(0.96)
Total assets $2,620,994 $1,936,777 $684,217
Total liabilities 637,318 215,115 422,203
Shareholders’ equity $1,983,676 $1,721,662 $262,014
Notes:
(1) See “Results of Operations – Litigation” and note 15 to the Consolidated Financial Statements.
(2)See “Results of Operations – Income Taxes” and note 9 to the Consolidated Financial Statements.
(3)See “Stock Split” and note 11 (a) to the Consolidated Financial Statements.
Research In Motion Limited •Incorporated Under the Laws of Ontario (In thousands of United States dollars, except per share data, and except as otherwise indicated)


