Blackberry 2005 Annual Report Download - page 22
Download and view the complete annual report
Please find page 22 of the 2005 Blackberry annual report below. You can navigate through the pages in the report by either clicking on the pages listed below, or by using the keyword search tool below to find specific information within the annual report.-
 1
1 -
2
-
3
-
4
-
5
-
6
-
7
-
8
-
9
-
10
-
11
-
 12
12 -
 13
13 -
 14
14 -
 15
15 -
 16
16 -
 17
17 -
 18
18 -
 19
19 -
 20
20 -
 21
21 -
 22
22 -
 23
23 -
 24
24 -
 25
25 -
 26
26 -
 27
27 -
 28
28 -
 29
29 -
 30
30 -
 31
31 -
 32
32 -
33
-
34
-
35
-
36
-
37
-
38
-
39
-
40
-
41
-
42
-
43
-
44
-
45
-
46
-
47
-
48
-
49
-
50
-
51
-
52
-
53
-
54
-
55
-
56
-
57
-
58
-
59
-
60
-
61
-
62
-
63
-
64
-
65
-
66
-
67
-
68
-
69
-
70
-
71
-
72
-
73
-
74
-
75
-
76
 |
 |

20
Research and development, Selling, marketing and administration, and Amortization
The Company continued to invest heavily in research and development, and sales, marketing and
administration. As revenue and gross margin growth rates were higher than these expense increases, RIM
realized financial net income leverage in its business model. Research and development, Selling, marketing
and administration, and Amortization expenses increased by $128.8 million or 64.7% to $327.9 million in
fiscal 2005 from $199.0 million in the preceding year. The 64.7% increase in fiscal 2005 was substantially
below the increases in revenue and gross margin of 127.1% and 163.4% respectively.
Litigation charges
Litigation expenses totalled $352.6 million, an increase of $317.4 million from $35.2 million in fiscal 2004,
as a result of the Company and NTP concluding a binding term sheet during the fourth quarter of fiscal 2005
– see “Results of Operations – Litigation” and note 15 to the Consolidated Financial Statements.
Income tax recovery
The Company recorded a net recovery of income taxes of $142.2 million in fiscal 2005 versus an income tax
recovery of $4.2 million in fiscal 2004, resulting in a net increase of $138.0 million in fiscal 2005 net income
– see “Results of Operations – Income Taxes” and note 9 to the Consolidated Financial Statements.
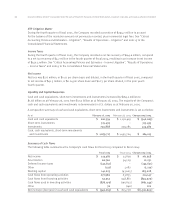
Selected Quarterly Financial Data – Unaudited
The following table sets forth RIM’s unaudited quarterly consolidated results of operations data for each
of the eight most recent quarters ended February 26, 2005. The information has been derived from RIM’s
unaudited consolidated financial statements that, in management’s opinion, have been prepared on a basis
consistent with the Consolidated Financial Statements and include all adjustments necessary for a fair
presentation of information when read in conjunction with the Consolidated Financial Statements. RIM’s
quarterly operating results have varied substantially in the past and may vary substantially in the future.
Accordingly, the information below is not necessarily indicative of results for any future quarter.
Fiscal 2005 Year
Fourth Third Second First
Quarter Quarter Quarter Quarter
(in thousands, except per share data)
Revenue $404,802 $ 365,852 $ 310,182 $ 269,611
Gross margin 229,924 191,295 158,681 134,633
Research and development, Selling, marketing
and administration, and Amortization 94,785 84,771 78,046 70,249
Litigation (1) 294,194 24,551 18,304 15,579
Investment income (11,926) (10,133) (8,588) (6,460)
Income (loss) before income taxes (147,129) 92,106 70,919 55,265
Provision for (recovery of) income taxes (2) (144,556) 1,711 326 293
Net income (loss) $(2,573) $ 90,395 $ 70,593 $ 54,972
Earnings (loss) per share
Basic $(0.01) $ 0.48 $ 0.38 $ 0.30
Diluted $(0.01) $ 0.46 $ 0.36 $ 0.28
Research and development $29,076 $ 27,137 $ 24,588 $ 20,379
Selling, marketing and administration 56,595 49,297 44,016 40,822
Amortization 9,114 8,337 9,442 9,048
$94,785 $ 84,771 $ 78,046 $ 70,249
Research In Motion Limited •Incorporated Under the Laws of Ontario (In thousands of United States dollars, except per share data, and except as otherwise indicated)