Blackberry 2005 Annual Report Download - page 30
Download and view the complete annual report
Please find page 30 of the 2005 Blackberry annual report below. You can navigate through the pages in the report by either clicking on the pages listed below, or by using the keyword search tool below to find specific information within the annual report.-
 1
1 -
2
-
3
-
4
-
5
-
6
-
7
-
8
-
9
-
10
-
11
-
12
-
13
-
14
-
15
-
16
-
17
-
18
-
19
-
 20
20 -
 21
21 -
 22
22 -
 23
23 -
 24
24 -
 25
25 -
 26
26 -
 27
27 -
 28
28 -
 29
29 -
 30
30 -
 31
31 -
 32
32 -
 33
33 -
 34
34 -
 35
35 -
 36
36 -
 37
37 -
 38
38 -
 39
39 -
 40
40 -
41
-
42
-
43
-
44
-
45
-
46
-
47
-
48
-
49
-
50
-
51
-
52
-
53
-
54
-
55
-
56
-
57
-
58
-
59
-
60
-
61
-
62
-
63
-
64
-
65
-
66
-
67
-
68
-
69
-
70
-
71
-
72
-
73
-
74
-
75
-
76
 |
 |

28
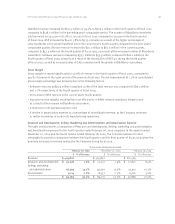
Summary Results of Operations – Fourth Quarter of Fiscal 2005 Compared to the Fourth Quarter of Fiscal 2004
The following table sets forth certain unaudited interim consolidated statement of operations data, which is
expressed in thousands of dollars and as a percentage of revenue for the interim periods indicated:
Change
For the three months ended February 26, 2005 February 28, 2004 2005/2004
(in thousands, except for percentages and per share amounts)
Revenue $404,802 100.0% $210,585 100.0% $194,217
Cost of sales 174,878 43.2% 107,109 50.9% 67,769
Gross margin 229,924 56.8% 103,476 49.1% 126,448
Expenses
Research and development 29,076 7.2% 17,877 8.5% 11,199
Selling, marketing
and administration 56,595 14.0% 32,310 15.3% 24,285
Amortization 9,114 2.2% 6,702 3.2% 2,412
Sub-total 94,785 23.4% 56,889 27.0% 37,896
Litigation (1) 294,194 72.7% 12,874 6.1% 281,320
388,979 96.1% 69,763 33.1% 319,216
Income (loss) from operations (159,055) (39.3%) 33,713 16.0% (192,768)
Investment income 11,926 2.9% 3,624 1.7% 8,302
Earnings (loss) before income taxes (147,129) (36.3%) 37,337 17.7% (184,466)
Recovery of income tax (2) (144,556) (35.7%) (4,200) (2.0%) (140,356)
Net income (loss) $(2,573) (0.6%) $41,537 19.7% $(44,110)
Earnings (loss) per share (3)
Basic $(0.01) $0.24 (3) $(0.25)
Diluted $(0.01) $0.23 (3) $(0.24)
Notes:
(1) See “Results of Operations – Litigation” and note 15 to the Consolidated Financial Statements.
(2)See “Results of Operations – Income Taxes” and note 9 to the Consolidated Financial Statements.
(3)See “Stock Split” and note 11 (a) to the Consolidated Financial Statements.
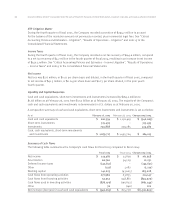
Revenue
Revenue for the fourth quarter of fiscal 2005 was $404.8 million, an increase of $194.2 million or 92.2%
from $210.6 million in the preceding year’s fourth quarter.
A comparative breakdown of the significant revenue streams for the fourth quarter is set forth in the
following table:
FY 2005 4th Quarter FY 2004 4th Quarter Change 2005/2004
Number of handhelds sold 712,000 379,000 333,000 87.9%
ASP $379 $365 $14 3.8%
Revenues
Handhelds $269,458 66.6% $138,570 65.8% $130,888 94.5%
Service 67,639 16.7% 47,459 22.5% 20,180 42.5%
Software 55,899 13.8% 16,242 7.7% 39,657 244.2%
Other 11,806 2.9% 8,314 4.0% 3,492 42.0%
$404,802 100.0% $210,585 100.0% $194,217 92.2%
Research In Motion Limited •Incorporated Under the Laws of Ontario (In thousands of United States dollars, except per share data, and except as otherwise indicated)