Blackberry 2005 Annual Report Download - page 45
Download and view the complete annual report
Please find page 45 of the 2005 Blackberry annual report below. You can navigate through the pages in the report by either clicking on the pages listed below, or by using the keyword search tool below to find specific information within the annual report.-
 1
1 -
2
-
3
-
4
-
5
-
6
-
7
-
8
-
9
-
10
-
11
-
12
-
13
-
14
-
15
-
16
-
17
-
18
-
19
-
20
-
21
-
22
-
23
-
24
-
25
-
26
-
27
-
28
-
29
-
30
-
31
-
32
-
33
-
34
-
 35
35 -
 36
36 -
 37
37 -
 38
38 -
 39
39 -
 40
40 -
 41
41 -
 42
42 -
 43
43 -
 44
44 -
 45
45 -
 46
46 -
 47
47 -
 48
48 -
 49
49 -
 50
50 -
 51
51 -
 52
52 -
 53
53 -
 54
54 -
 55
55 -
56
-
57
-
58
-
59
-
60
-
61
-
62
-
63
-
64
-
65
-
66
-
67
-
68
-
69
-
70
-
71
-
72
-
73
-
74
-
75
-
76
 |
 |

43
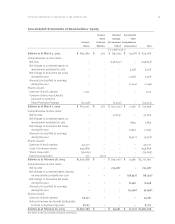
Consolidated Statements of Cash Flows
For the year ended February 26, 2005 February 28, 2004 March 1, 2003
U.S. GAAP (note 1)
Cash flows from operating activities
Net income (loss) $213,387 $51,829 $ (148,857)
Items not requiring an outlay of cash:
Amortization 66,760 54,529 31,147
Deferred income taxes (143,651) – 29,244
Loss (gain) on disposal of capital assets (69) 223 502
Loss on foreign currency translation of long-term debt 12 859 (339)
Unrealized foreign exchange gain (80) – –
Net changes in working capital items (note 18(a)) 141,623 (43,605) 91,093
277,982 63,835 2,790
Cash flows from financing activities
Issuance of share capital and warrants 54,151 994,640 1,155
Financing costs – (39,629) –
Buyback of common shares pursuant to
Common Share Purchase Program (note 11(a)) – – (24,502)
Repayment of long-term debt (199) (6,130) (614)
53,952 948,881 (23,961)
Cash flows from investing activities
Acquisition of investments (615,098) (186,989) (190,030)
Proceeds on sale or maturity of investments 18,385 43,746 –
Acquisition of capital assets (109,363) (21,815) (39,670)
Acquisition of intangible assets (17,061) (32,252) (30,997)
Acquisition of subsidiaries (note 8) (3,888) 478 (21,990)
Acquisition of short-term investments (227,072) (24,071) (41,900)
Proceeds on sale and maturity of short-term investments 76,022 24,071 345,983
(878,075) (196,832) 21,396
Effect of foreign exchange on cash and cash equivalents 76 (146) (20)
Net increase (decrease) in cash and cash
equivalents for the year (546,065) 815,738 205
Cash and cash equivalents, beginning of year 1,156,419 340,681 340,476
Cash and cash equivalents, end of year $ 610,354 $1,156,419 $ 340,681
See notes to the consolidated financial statements.
For the years ended February 26, 2005, February 28, 2004 and March 1, 2003