Bed, Bath and Beyond 2013 Annual Report Download - page 9
Download and view the complete annual report
Please find page 9 of the 2013 Bed, Bath and Beyond annual report below. You can navigate through the pages in the report by either clicking on the pages listed below, or by using the keyword search tool below to find specific information within the annual report.-
 1
1 -
 2
2 -
 3
3 -
 4
4 -
 5
5 -
 6
6 -
 7
7 -
 8
8 -
 9
9 -
 10
10 -
 11
11 -
 12
12 -
 13
13 -
 14
14 -
 15
15 -
 16
16 -
 17
17 -
 18
18 -
 19
19 -
 20
20 -
21
-
22
-
23
-
24
-
25
-
26
-
27
-
28
-
29
-
30
-
31
-
32
-
33
-
34
-
35
-
36
-
37
-
38
-
39
-
40
-
41
-
42
-
43
-
44
-
45
-
46
-
47
-
48
-
49
-
50
-
51
-
52
-
53
-
54
-
55
-
56
-
57
-
58
-
59
-
60
-
61
-
62
-
63
-
64
-
65
-
66
-
67
-
68
-
69
-
70
-
71
-
72
-
73
-
74
-
75
-
76
-
77
-
78
-
79
-
80
 |
 |

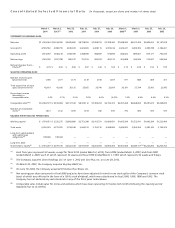
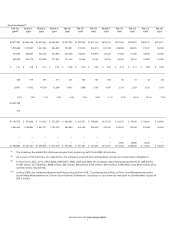
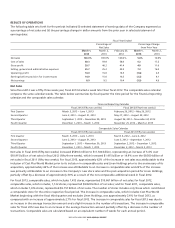
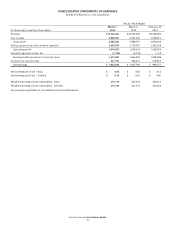
RESULTS OF OPERATIONS
The following table sets forth for the periods indicated (i) selected statement of earnings data of the Company expressed as
a percentage of net sales and (ii) the percentage change in dollar amounts from the prior year in selected statement of
earnings data:
Fiscal Year Ended
Percentage of
Net Sales
Percentage Change
from Prior Year
March 1,
2014
March 2,
2013
February 25,
2012
March 1,
2014
March 2,
2013
Net sales 100.0% 100.0% 100.0% 5.4% 14.9%
Cost of sales 60.3 59.8 58.6 6.3 17.2
Gross profit 39.7 40.2 41.4 4.0 11.6
Selling, general and administrative expenses 25.7 25.2 24.9 7.3 16.4
Operating profit 14.0 15.0 16.5 (1.4) 4.5
Earnings before provision for income taxes 14.0 15.0 16.5 (1.3) 4.1
Net earnings 8.9 9.5 10.4 (1.5) 4.9
Net Sales
Since fiscal 2012 was a fifty-three week year, fiscal 2013 started a week later than fiscal 2012. The comparable sales calendar
compares the same calendar weeks. The table below summarizes by fiscal quarter the time period for the financial reporting
calendar and the comparable sales calendar.
Financial Reporting Calendar
Fiscal 2013 (fifty-two weeks) Fiscal 2012 (fifty-three weeks)
First Quarter March 3, 2013 − June 1, 2013 February 26, 2012 − May 26, 2012
Second Quarter June 2, 2013 − August 31, 2013 May 27, 2012 − August 25, 2012
Third Quarter September 1, 2013 − November 30, 2013 August 26, 2012 − November 24, 2012
Fourth Quarter December 1, 2013 − March 1, 2014 November 25, 2012 − March 2, 2013
Comparable Sales Calendar
Fiscal 2013 (fifty-two weeks) Fiscal 2012 (fifty-two weeks)
First Quarter March 3, 2013 − June 1, 2013 March 4, 2012 − June 2, 2012
Second Quarter June 2, 2013 − August 31, 2013 June 3, 2012 − September 1, 2012
Third Quarter September 1, 2013 − November 30, 2013 September 2, 2012 − December 1, 2012
Fourth Quarter December 1, 2013 − March 1, 2014 December 2, 2012 − March 2, 2013
Net sales in fiscal 2013 (fifty-two weeks) increased $589.4 million to $11.504 billion, representing an increase of 5.4% over
$10.915 billion of net sales in fiscal 2012 (fifty-three weeks), which increased $1.415 billion or 14.9% over the $9.500 billion of
net sales in fiscal 2011 (fifty-two weeks). For fiscal 2013, approximately 62% of the increase in net sales was attributable to the
inclusion of Cost Plus World Market prior to its inclusion in comparable sales and Linen Holdings prior to the anniversary of its
acquisition, approximately 42% of the increase was attributable to an increase in comparable sales and 26% of the increase
was primarily attributable to an increase in the Company’s new store sales and the post-acquisition period for Linen Holdings,
partially offset by a decrease of approximately 30% as a result of the non-comparable additional week in fiscal 2012.
For fiscal 2013, comparable sales, which includes 1,412 stores, represented $10.661 billion of net sales; for fiscal 2012,
comparable sales, which includes, 1,122 stores, represented $9.820 billion of net sales; and for fiscal 2011, comparable sales,
which includes 1,076 stores, represented $9.157 billion of net sales. The number of stores includes only those which constituted
a comparable store for the entire respective fiscal period. The increase in comparable sales, which includes Cost Plus World
Market beginning with the fiscal third quarter and excludes Linen Holdings, was approximately 2.4% for fiscal 2013, as
compared with an increase of approximately 2.7% for fiscal 2012. The increase in comparable sales for fiscal 2013 was due to
an increase in the average transaction amount and a slight increase in the number of transactions. The increase in comparable
sales for fiscal 2012 was due to an increase in the average transaction amount partially offset by a decrease in the number of
transactions. Comparable sales are calculated based on an equivalent number of weeks for each annual period.
BED BATH & BEYOND 2013 ANNUAL REPORT
7