Bed, Bath and Beyond 2013 Annual Report Download - page 12
Download and view the complete annual report
Please find page 12 of the 2013 Bed, Bath and Beyond annual report below. You can navigate through the pages in the report by either clicking on the pages listed below, or by using the keyword search tool below to find specific information within the annual report.-
 1
1 -
 2
2 -
 3
3 -
 4
4 -
 5
5 -
 6
6 -
 7
7 -
 8
8 -
 9
9 -
 10
10 -
 11
11 -
 12
12 -
 13
13 -
 14
14 -
 15
15 -
 16
16 -
 17
17 -
 18
18 -
 19
19 -
 20
20 -
 21
21 -
 22
22 -
23
-
24
-
25
-
26
-
27
-
28
-
29
-
30
-
31
-
32
-
33
-
34
-
35
-
36
-
37
-
38
-
39
-
40
-
41
-
42
-
43
-
44
-
45
-
46
-
47
-
48
-
49
-
50
-
51
-
52
-
53
-
54
-
55
-
56
-
57
-
58
-
59
-
60
-
61
-
62
-
63
-
64
-
65
-
66
-
67
-
68
-
69
-
70
-
71
-
72
-
73
-
74
-
75
-
76
-
77
-
78
-
79
-
80
 |
 |
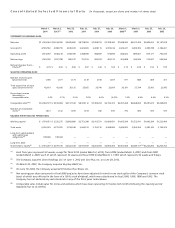
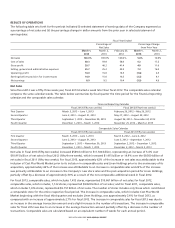
Fiscal 2012 compared to Fiscal 2011
Net cash provided by operating activities in fiscal 2012 was $1.193 billion, compared with $1.225 billion in fiscal 2011. Year
over year, the Company experienced an increase in cash used by the net components of working capital (primarily merchandise
inventories, other current assets and accrued expenses and other current liabilities, partially offset by accounts payable and
income taxes payable) and an increase in net earnings.
Retail inventory at cost per square foot was $58.12 as of March 2, 2013, as compared to $57.35 as of February 25, 2012.
Net cash used in investing activities in fiscal 2012 was $665.8 million, compared with $364.0 million in fiscal 2011. In fiscal 2012,
net cash used in investing activities was due to payments, net of cash acquired, of $643.1 million related to the Cost Plus World
Market and Linen Holdings acquisitions, $314.7 million for capital expenditures and $40.0 million for the acquisition of
trademarks, partially offset by redemptions of $332.0 million of investment securities, net of purchases. In fiscal 2011, net cash
used in investing activities was due to $243.4 million of capital expenditures and $120.6 million of purchases of investment
securities, net of redemptions.
Net cash used in financing activities for fiscal 2012 was $965.4 million, compared with $1.042 billion in fiscal 2011. The
decrease in net cash used was primarily due to a decrease in common stock repurchases of $216.7 million, partially offset by a
$114.7 million decrease in cash proceeds from the exercise of stock options and a $25.5 million payment for a credit facility
assumed in acquisition.
Auction Rate Securities
As of March 1, 2014, the Company held approximately $47.7 million of net investments in auction rate securities. Beginning in mid-
February 2008, the auction process for the Company’s auction rate securities failed and continues to fail. These failed auctions
result in a lack of liquidity in the securities but do not affect the underlying collateral of the securities. All of these investments
carry triple-A credit ratings from one or more of the major credit rating agencies. As of March 1, 2014, these securities had a
temporary valuation adjustment of approximately $3.3 million to reflect their current lack of liquidity. Since this valuation
adjustment is deemed to be temporary, it was recorded in accumulated other comprehensive loss, net of a related tax benefit, and
did not affect the Company’s net earnings for fiscal 2013. The Company will continue to monitor the market for these securities
and will expense any permanent changes to the value of the remaining securities, if any, as they occur.
The Company does not anticipate that any continuing lack of liquidity in its auction rate securities will affect its ability to finance
its operations, including its expansion program, share repurchase program, and planned capital expenditures. The Company
continues to monitor efforts by the financial markets to find alternative means for restoring the liquidity of these investments.
These investments will remain primarily classified as non-current assets until the Company has better visibility as to when their
liquidity will be restored. The classification and valuation of these securities will continue to be reviewed quarterly.
Other Fiscal 2013 Information
At March 1, 2014, the Company maintained two uncommitted lines of credit of $100 million each, with expiration dates of
September 2, 2014 and February 28, 2015, respectively. These uncommitted lines of credit are currently and are expected to be
used for letters of credit in the ordinary course of business. During fiscal 2013, the Company did not have any direct
borrowings under the uncommitted lines of credit. As of March 1, 2014, there was approximately $4.5 million of outstanding
letters of credit. Although no assurances can be provided, the Company intends to renew both uncommitted lines of credit
before the respective expiration dates. In addition, as of March 1, 2014, the Company maintained unsecured standby letters of
credit of $74.3 million, primarily for certain insurance programs.
Between December 2004 and December 2012, the Company’s Board of Directors authorized, through share repurchase
programs, the repurchase of $7.450 billion of the Company’s common stock.
Since 2004 through the end of fiscal 2013, the Company has repurchased approximately $6.3 billion of its common stock through
share repurchase programs. The Company has approximately $1.1 billion remaining of authorized share repurchases as of March 1,
2014. The execution of the Company’s share repurchase program will consider current business and market conditions.
The Company has authorization to make repurchases from time to time in the open market or through other parameters
approved by the Board of Directors pursuant to existing rules and regulations.
MANAGEMENT’S DISCUSSION AND ANALYSIS OF FINANCIAL CONDITION AND RESULTS OF OPERATIONS
(continued)
BED BATH & BEYOND 2013 ANNUAL REPORT
10