Bed, Bath and Beyond 2013 Annual Report Download - page 8
Download and view the complete annual report
Please find page 8 of the 2013 Bed, Bath and Beyond annual report below. You can navigate through the pages in the report by either clicking on the pages listed below, or by using the keyword search tool below to find specific information within the annual report.-
 1
1 -
 2
2 -
 3
3 -
 4
4 -
 5
5 -
 6
6 -
 7
7 -
 8
8 -
 9
9 -
 10
10 -
 11
11 -
 12
12 -
 13
13 -
 14
14 -
 15
15 -
 16
16 -
 17
17 -
 18
18 -
 19
19 -
20
-
21
-
22
-
23
-
24
-
25
-
26
-
27
-
28
-
29
-
30
-
31
-
32
-
33
-
34
-
35
-
36
-
37
-
38
-
39
-
40
-
41
-
42
-
43
-
44
-
45
-
46
-
47
-
48
-
49
-
50
-
51
-
52
-
53
-
54
-
55
-
56
-
57
-
58
-
59
-
60
-
61
-
62
-
63
-
64
-
65
-
66
-
67
-
68
-
69
-
70
-
71
-
72
-
73
-
74
-
75
-
76
-
77
-
78
-
79
-
80
 |
 |
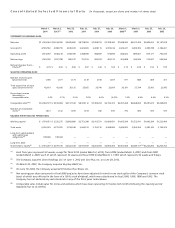
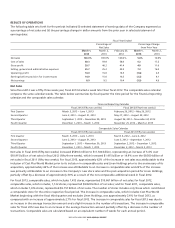
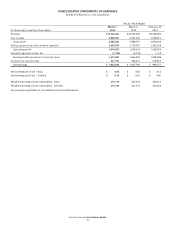
• Gross profit for fiscal 2013 was $4.566 billion or 39.7% of net sales compared with $4.389 billion or 40.2% of net
sales for fiscal 2012 and $3.931 billion or 41.4% of net sales for fiscal 2011.
• Selling, general and administrative expenses (‘‘SG&A’’) for fiscal 2013 were $2.951 billion or 25.7% of net sales compared
with $2.751 billion or 25.2% of net sales for fiscal 2012 and $2.363 billion or 24.9% of net sales for fiscal 2011.
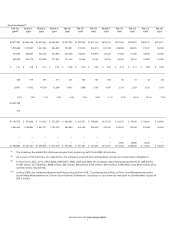
• The effective tax rate was 36.6%, 36.5% and 37.0% for fiscal years 2013, 2012 and 2011, respectively. The tax rate
included discrete tax items resulting in net benefits of approximately $20.0 million, $26.7 million and $20.7 million,
respectively, for fiscal 2013, 2012 and 2011.
• For the fiscal year ended March 1, 2014 (fifty-two weeks), net earnings per diluted share were $4.79 ($1.022 billion),
an increase of approximately 5%, as compared with net earnings per diluted share of $4.56 ($1.038 billion) for fiscal
2012 (fifty-three weeks), which was an increase of approximately 12% from net earnings per diluted share of $4.06
($989.5 million) for fiscal 2011 (fifty-two weeks). For the fiscal year ended March 1, 2014, the increase in net earnings
per diluted share is the result of the items described above and the impact of the Company’s repurchases of its
common stock, partially offset by a reduction of approximately $0.06 to $0.07 per diluted share as a result of the
disruptive weather in the fiscal fourth quarter. For the fiscal year ended March 2, 2013, the increase in net earnings
per diluted share is the result of the items described above, which includes an estimated $0.05 benefit related to the
fifty-third week in fiscal year 2012 and the impact of the Company’s repurchases of its common stock, partially offset
by the negative impact of Hurricane Sandy in the fiscal third quarter.
During fiscal 2013, the Company continued the integration of the two fiscal 2012 acquisitions as well as advanced initiatives
including: enhanced the omnichannel experience for its customers by replatforming and adding improved functionality to its
Baby and BBB websites, replatforming its mobile sites and applications and growing and developing its information
technology, analytics, marketing and e-commerce groups; completed the construction of a new information technology data
center and are engaged in equipping the facility which will enhance the Company’s disaster recovery capabilities and support
its overall information technology systems; installed energy efficient lighting, and heating and cooling systems in the
Company’s stores; and continued the ongoing deployment of new and enhanced systems and equipment to allow its stores to
take advantage of new technologies and processes.
Capital expenditures for fiscal 2013, 2012 and 2011 were $317.2 million, $314.7 million and $243.4 million, respectively. The
Company remains committed to making the required investments in its infrastructure to help position the Company for
continued growth and success. The Company continues to review and prioritize its capital needs while continuing to make
investments, principally for information technology enhancements, including omnichannel capabilities, new stores, existing
store improvements, and other projects whose impact is considered important to its future.
During fiscal 2013, 2012 and 2011, the Company repurchased 18.3 million, 16.1 million and 21.5 million shares, respectively, of
its common stock at a total cost of approximately $1.284 billion, $1.001 billion and $1.218 billion, respectively. Since the end of
fiscal 2011, the Company has returned approximately 89% of its cash flows from operations to its shareholders through share
repurchase programs.
During fiscal 2013, the Company opened a total of 33 new stores. In addition, the Company continued to optimize its
operations in a number of trade areas through renovating and repositioning stores in various markets, which also included the
closing of eight stores during fiscal 2013. The Company plans to continue to expand its operations and invest in its
infrastructure to reach its long term objectives. In fiscal 2014, the Company expects to open approximately 30 new stores
company-wide and will continue to renovate stores or reposition stores within various markets, when appropriate.
Additionally, during fiscal 2014, the Company will continue to enhance its omnichannel capabilities, through, among other
things, continuing to add new functionality and assortment to its selling websites, mobile sites and applications and opening
an additional distribution facility for both direct to customer and store fulfillment.
MANAGEMENT’S DISCUSSION AND ANALYSIS OF FINANCIAL CONDITION AND RESULTS OF OPERATIONS
(continued)
BED BATH & BEYOND 2013 ANNUAL REPORT
6