Bed, Bath and Beyond 2013 Annual Report Download - page 10
Download and view the complete annual report
Please find page 10 of the 2013 Bed, Bath and Beyond annual report below. You can navigate through the pages in the report by either clicking on the pages listed below, or by using the keyword search tool below to find specific information within the annual report.-
 1
1 -
 2
2 -
 3
3 -
 4
4 -
 5
5 -
 6
6 -
 7
7 -
 8
8 -
 9
9 -
 10
10 -
 11
11 -
 12
12 -
 13
13 -
 14
14 -
 15
15 -
 16
16 -
 17
17 -
 18
18 -
 19
19 -
 20
20 -
 21
21 -
22
-
23
-
24
-
25
-
26
-
27
-
28
-
29
-
30
-
31
-
32
-
33
-
34
-
35
-
36
-
37
-
38
-
39
-
40
-
41
-
42
-
43
-
44
-
45
-
46
-
47
-
48
-
49
-
50
-
51
-
52
-
53
-
54
-
55
-
56
-
57
-
58
-
59
-
60
-
61
-
62
-
63
-
64
-
65
-
66
-
67
-
68
-
69
-
70
-
71
-
72
-
73
-
74
-
75
-
76
-
77
-
78
-
79
-
80
 |
 |
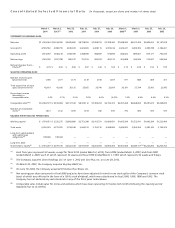
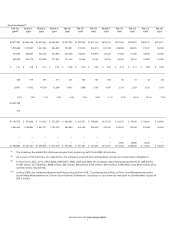
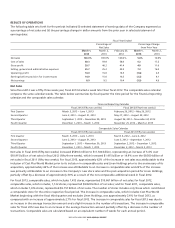
Sales of domestics merchandise accounted for approximately 36%, 39% and 40% of net sales in fiscal 2013, 2012 and 2011,
respectively, of which the Company estimates that bed linens accounted for approximately 12% of net sales in fiscal 2013, 2012
and 2011, respectively. The remaining net sales in fiscal 2013, 2012 and 2011 of 64%, 61% and 60%, respectively, represented
sales of home furnishings. No other individual product category accounted for 10% or more of net sales during fiscal 2013,
2012 or 2011.
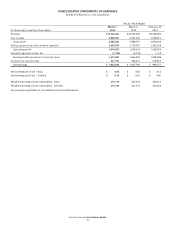
Gross Profit
Gross profit in fiscal 2013, 2012 and 2011 was $4.566 billion or 39.7% of net sales, $4.389 billion or 40.2% of net sales and
$3.931 billion or 41.4% of net sales, respectively. The decreases in the gross profit margin as a percentage of net sales between
fiscal 2013 and 2012 and between fiscal 2012 and 2011 were primarily attributed to an increase in coupons, due to increases in
both redemptions and the average coupon amount, and a shift in the mix of merchandise sold to lower margin categories.
Selling, General and Administrative Expenses
SG&A was $2.951 billion or 25.7% of net sales in fiscal 2013, $2.751 billion or 25.2% of net sales in fiscal 2012 and
$2.363 billion or 24.9% of net sales in fiscal 2011. The increase in SG&A between fiscal 2013 and 2012 as a percentage of net
sales was primarily due to higher technology expenses and depreciation and a relative increase in payroll and payroll-related
items (including salaries, workers’ compensation and medical insurance). The inclusion of the financial results of the
acquisitions for the periods prior to each of their one year anniversaries, which occurred in the first half of fiscal 2013, also
contributed to the increase in SG&A as a percentage of net sales. The increase in SG&A between fiscal 2012 and 2011 as
a percentage of net sales was primarily due to a relative increase in advertising expenses. As a percentage of net sales, the
relative increase in advertising expenses was higher due to the inclusion of the financial results of the acquisitions completed
in fiscal 2012. In addition, the fifty-third week has relatively higher SG&A than the year to date fifty-two weeks and increased
SG&A by approximately 10 basis points.
Operating Profit
Operating profit for fiscal 2013 was $1.615 billion or 14.0% of net sales, $1.638 billion or 15.0% of net sales in fiscal 2012 and
$1.568 billion or 16.5% of net sales in fiscal 2011. The changes in operating profit as a percentage of net sales between fiscal
2013 and 2012 and between fiscal 2012 and 2011 were the result of the changes in gross profit margin and SG&A as a
percentage of net sales as described above.
Interest (Expense) Income
Interest expense was $1.1 million and $4.2 million in fiscal 2013 and fiscal 2012, respectively and interest income was
$1.1 million in fiscal 2011. Interest expense for fiscal 2012 increased from fiscal 2011 primarily due to the inclusion of interest
expense related to the sale/leaseback obligations on the distribution facilities acquired as part of the fiscal 2012 acquisitions.
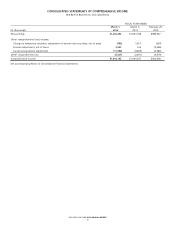
Income Taxes
The effective tax rate was 36.6% for fiscal 2013, 36.5% for fiscal 2012 and 37.0% for fiscal 2011. For fiscal 2013 and fiscal 2012,
the tax rate included a net benefit of approximately $20.0 million and $26.7 million, respectively, primarily due to the
recognition of favorable discrete state tax items. For fiscal 2011, the tax rate included an approximate $20.7 million net benefit
primarily due to the settlement of certain discrete tax items from on-going examinations, the recognition of favorable discrete
state tax items and from changing the blended state tax rate of deferred income taxes.
The Company expects continued volatility in the effective tax rate from year to year because the Company is required each
year to determine whether new information changes the assessment of both the probability that a tax position will effectively
be sustained and the appropriateness of the amount of recognized benefit.
EXPANSION PROGRAM
The Company is engaged in an ongoing expansion program involving the opening of new stores in both new and existing
markets, the expansion or renovation of existing stores, the repositioning of stores within markets when appropriate, the
evolution of its omnichannel shopping environment and the continuous review of strategic acquisitions.
MANAGEMENT’S DISCUSSION AND ANALYSIS OF FINANCIAL CONDITION AND RESULTS OF OPERATIONS
(continued)
BED BATH & BEYOND 2013 ANNUAL REPORT
8