Bed, Bath and Beyond 2013 Annual Report Download - page 2
Download and view the complete annual report
Please find page 2 of the 2013 Bed, Bath and Beyond annual report below. You can navigate through the pages in the report by either clicking on the pages listed below, or by using the keyword search tool below to find specific information within the annual report.-
 1
1 -
 2
2 -
 3
3 -
 4
4 -
 5
5 -
 6
6 -
 7
7 -
 8
8 -
 9
9 -
 10
10 -
 11
11 -
 12
12 -
 13
13 -
14
-
15
-
16
-
17
-
18
-
19
-
20
-
21
-
22
-
23
-
24
-
25
-
26
-
27
-
28
-
29
-
30
-
31
-
32
-
33
-
34
-
35
-
36
-
37
-
38
-
39
-
40
-
41
-
42
-
43
-
44
-
45
-
46
-
47
-
48
-
49
-
50
-
51
-
52
-
53
-
54
-
55
-
56
-
57
-
58
-
59
-
60
-
61
-
62
-
63
-
64
-
65
-
66
-
67
-
68
-
69
-
70
-
71
-
72
-
73
-
74
-
75
-
76
-
77
-
78
-
79
-
80
 |
 |

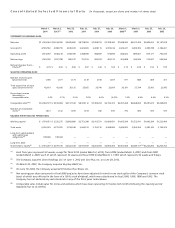
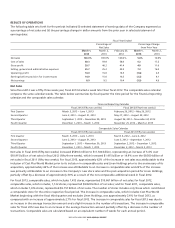
Consolidated Selected Financial Data (in thousands, except per share and number of stores data)
March 1,
2014
March 2,
2013
(2)
Feb. 25,
2012
Feb. 26,
2011
Feb. 27,
2010
Feb. 28,
2009
March 1,
2008
(3)
March 3,
2007
Feb. 25,
2006
Feb. 26,
2005
STATEMENT OF EARNINGS DATA:
Net sales $11,503,963 $10,914,585 $9,499,890 $8,758,503 $7,828,793 $7,208,340 $7,048,942 $6,617,429 $5,809,562 $5,147,678
Gross profit 4,565,582 4,388,755 3,930,933 3,622,929 3,208,119 2,873,236 2,925,231 2,835,402 2,485,748 2,186,301
Operating profit 1,614,587 1,638,218 1,568,369 1,288,458 980,687 673,896 838,022 889,401 879,171 792,414
Net earnings 1,022,290 1,037,788 989,537 791,333 600,033 425,123 562,808 594,244 572,847 504,964
Net earnings per share −
Diluted
(5)
$ 4.79 $ 4.56 $ 4.06 $ 3.07 $ 2.30 $ 1.64 $ 2.10 $ 2.09 $ 1.92 $ 1.65
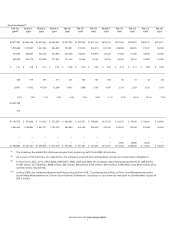
SELECTED OPERATING DATA:
Number of stores open
(at period end) 1,496 1,471 1,173 1,139 1,100 1,037 971 888 809 721
Total square feet of store
space (at period end) 42,619 42,030 36,125 35,055 33,740 32,050 30,181 27,794 25,502 22,945
Percentage increase
(decrease) in
comparable sales 2.4% 2.7% 5.9% 7.8% 4.4% (2.4)% 1.0% 4.9% 4.6% 4.5%
Comparable sales
(6)(7)
$10,660,573 $ 9,819,904 $9,157,183 $8,339,112 $7,409,203 $6,746,472 $6,457,268 $6,068,694 $5,281,675 $4,468,095
Number of comparable
stores
(7)
1,412 1,122 1,076 1,013 942 874 792 683 605 535
BALANCE SHEET DATA (AT PERIOD END):
Working capital $ 1,974,651 $ 2,232,275 $2,803,809 $2,751,398 $2,413,791 $1,609,831 $1,065,599 $1,553,541 $1,082,399 $1,223,409
Total assets 6,356,033 6,279,952 5,724,546 5,646,193 5,152,130 4,268,843 3,844,093 3,959,304 3,382,140 3,199,979
Long-term sale/leaseback
and capital lease
obligations
(8)
108,046 108,364 ————————
Long-term debt — —————————
Shareholders’ equity
(9)
$ 3,941,287 $ 4,079,730 $3,922,528 $3,931,659 $3,652,904 $3,000,454 $2,561,828 $2,649,151
(10)
$2,262,450 $2,203,762
(1)
Each fiscal year represents 52 weeks, except for fiscal 2012 (ended March 2, 2013), fiscal 2006 (ended March 3, 2007) and fiscal 2000
(ended March 3, 2001) each of which represent 53 weeks and fiscal 1996 (ended March 1, 1997) which represents 52 weeks and 6 days.
(2)
The Company acquired Linen Holdings, LLC on June 1, 2012 and Cost Plus, Inc. on June 29, 2012.
(3)
On March 22, 2007, the Company acquired Buy Buy BABY, Inc.
(4)
On June 19, 2003, the Company acquired Christmas Tree Shops, Inc.
(5)
Net earnings per share amounts for fiscal 2000 and prior have been adjusted for two-for-one stock splits of the Company’s common stock
(each of which was effected in the form of a 100% stock dividend), which were distributed in fiscal 2000, 1998, 1996 and 1993. The
Company has not declared any cash dividends in any of the fiscal years noted above.
(6)
Comparable sales include sales for stores and websites which have been operating for twelve full months following the opening period
(typically four to six weeks).