Bed, Bath and Beyond 2013 Annual Report Download - page 29
Download and view the complete annual report
Please find page 29 of the 2013 Bed, Bath and Beyond annual report below. You can navigate through the pages in the report by either clicking on the pages listed below, or by using the keyword search tool below to find specific information within the annual report.-
 1
1 -
2
-
3
-
4
-
5
-
6
-
7
-
8
-
9
-
10
-
11
-
12
-
13
-
14
-
15
-
16
-
17
-
18
-
 19
19 -
 20
20 -
 21
21 -
 22
22 -
 23
23 -
 24
24 -
 25
25 -
 26
26 -
 27
27 -
 28
28 -
 29
29 -
 30
30 -
 31
31 -
 32
32 -
 33
33 -
 34
34 -
 35
35 -
 36
36 -
 37
37 -
 38
38 -
 39
39 -
40
-
41
-
42
-
43
-
44
-
45
-
46
-
47
-
48
-
49
-
50
-
51
-
52
-
53
-
54
-
55
-
56
-
57
-
58
-
59
-
60
-
61
-
62
-
63
-
64
-
65
-
66
-
67
-
68
-
69
-
70
-
71
-
72
-
73
-
74
-
75
-
76
-
77
-
78
-
79
-
80
 |
 |

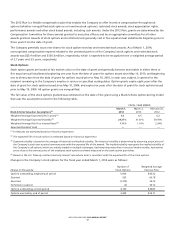
The following tables present the valuation of the Company’s financial assets as of March 1, 2014 and March 2, 2013, measured
at fair value on a recurring basis by input level:
As of March 1, 2014
(in millions)
Quoted Prices
in Active
Markets for
Identical Assets
(Level 1)
Significant
Unobservable
Inputs
(Level 3) Total
Long term − available-for-sale securities:
Auction rate securities $ — $47.7 $47.7
Long term − trading securities:
Nonqualified deferred compensation plan assets 39.7 — 39.7
Total $39.7 $47.7 $87.4
As of March 2, 2013
(in millions)
Quoted Prices
in Active
Markets for
Identical Assets
(Level 1)
Significant
Unobservable
Inputs
(Level 3) Total
Long term − available-for-sale securities:
Auction rate securities $ — $49.0 $49.0
Long term − trading securities:
Nonqualified deferred compensation plan assets 28.3 — 28.3
Total $28.3 $49.0 $77.3
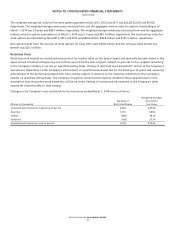
The following table presents the changes in the Company’s financial assets that are measured at fair value on a recurring basis
using significant unobservable inputs (Level 3):
(in millions)
Auction Rate
Securities
Balance on March 2, 2013, net of temporary valuation adjustment $49.0
Change in temporary valuation adjustment included in accumulated other comprehensive loss (1.3)
Balance on March 1, 2014, net of temporary valuation adjustment $47.7
6. INVESTMENT SECURITIES
The Company’s investment securities as of March 1, 2014 and March 2, 2013 are as follows:
(in millions)
March 1,
2014
March 2,
2013
Available-for-sale securities:
Long term $ 47.7 $ 49.0
Trading securities:
Long term 39.7 28.3
Held-to-maturity securities:
Short term 489.3 449.9
Total investment securities $576.7 $527.2
BED BATH & BEYOND 2013 ANNUAL REPORT
27