Bed, Bath and Beyond 2013 Annual Report Download - page 11
Download and view the complete annual report
Please find page 11 of the 2013 Bed, Bath and Beyond annual report below. You can navigate through the pages in the report by either clicking on the pages listed below, or by using the keyword search tool below to find specific information within the annual report.-
 1
1 -
 2
2 -
 3
3 -
 4
4 -
 5
5 -
 6
6 -
 7
7 -
 8
8 -
 9
9 -
 10
10 -
 11
11 -
 12
12 -
 13
13 -
 14
14 -
 15
15 -
 16
16 -
 17
17 -
 18
18 -
 19
19 -
 20
20 -
 21
21 -
 22
22 -
23
-
24
-
25
-
26
-
27
-
28
-
29
-
30
-
31
-
32
-
33
-
34
-
35
-
36
-
37
-
38
-
39
-
40
-
41
-
42
-
43
-
44
-
45
-
46
-
47
-
48
-
49
-
50
-
51
-
52
-
53
-
54
-
55
-
56
-
57
-
58
-
59
-
60
-
61
-
62
-
63
-
64
-
65
-
66
-
67
-
68
-
69
-
70
-
71
-
72
-
73
-
74
-
75
-
76
-
77
-
78
-
79
-
80
 |
 |
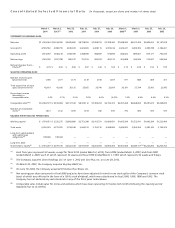
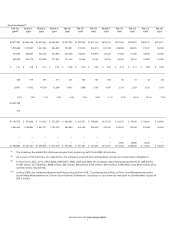
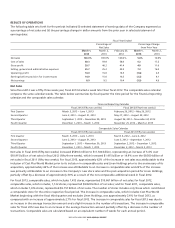
In the 22-year period from the beginning of fiscal 1992 to the end of fiscal 2013, the chain has grown from 34 to 1,496 stores
plus its various websites, other interactive platforms and distribution facilities. Total store square footage grew from
approximately 0.9 million square feet at the beginning of fiscal 1992 to approximately 42.6 million square feet at the end of
fiscal 2013. During fiscal 2013, the Company opened a total of 33 new stores. In addition, the Company continued to optimize
its operations in a number of trade areas through renovating and repositioning stores in various markets, which included the
closing of eight stores. In fiscal 2013, consolidated store space, net of openings and closings for all concepts, increased by
0.6 million square feet. Additionally, the Company is a partner in a joint venture which opened one store during fiscal 2013
and as of March 1, 2014, operated a total of four retail stores in Mexico under the name Bed Bath & Beyond.
During fiscal 2012, the Company acquired Linen Holdings and Cost Plus World Market.
The Company plans to continue to expand its operations and invest in its infrastructure to reach its long term objectives. In
fiscal 2014, the Company expects to open approximately 30 new stores company-wide and will continue to renovate stores or
reposition stores within various markets, when appropriate. Additionally, the Company will continue to place health and
beauty care offerings in selected stores as well as specialty food and beverage departments in selected BBB stores. The
continued growth of the Company is dependent, in part, upon the Company’s ability to execute its expansion program
successfully. Additionally, during fiscal 2014, the Company plans to enhance its omnichannel capabilities by continuing to add
new functionality and assortment to its selling websites, mobile sites and applications; furthering the development work
necessary for a new and more robust point of sale system; continuing the deployment of systems and equipment to allow the
Company’s stores to take advantage of new technologies and processes; continuing to strengthen its information technology,
analytics, marketing and e-commerce groups and opening an additional distribution facility for both direct to customer and
store fulfillment.
LIQUIDITY AND CAPITAL RESOURCES
The Company has been able to finance its operations, including its expansion program, entirely through internally generated
funds. For fiscal 2014, the Company believes that it can continue to finance its operations, including its expansion program,
share repurchase program and planned capital expenditures, entirely through existing and internally generated funds. Capital
expenditures for fiscal 2014, principally for information technology enhancements, including omnichannel capabilities, new
stores, existing store improvements, and other projects are planned to be approximately $350 million, subject to the timing
and composition of the projects. In addition, the Company periodically reviews its alternatives with respect to optimizing its
capital structure.
Fiscal 2013 compared to Fiscal 2012
Net cash provided by operating activities in fiscal 2013 was $1.383 billion, compared with $1.193 billion in fiscal 2012. Year
over year, the Company experienced an increase in cash provided by the net components of working capital (primarily
merchandise inventories, accounts payable and other current assets) and an increase in net earnings, as adjusted for non-cash
expenses (primarily depreciation).
Retail inventory at cost per square foot was $59.68 as of March 1, 2014, as compared to $58.12 as of March 2, 2013.
Net cash used in investing activities in fiscal 2013 was $359.8 million, compared with $665.8 million in fiscal 2012. In fiscal 2013,
net cash used in investing activities was primarily due to $317.2 million of capital expenditures and $39.1 million of purchases
of investment securities, net of redemptions. In fiscal 2012, net cash used in investing activities was due to payments, net of
cash acquired, of $643.1 million related to the Cost Plus World Market and Linen Holdings acquisitions, $314.7 million for
capital expenditures and $40.0 million for the acquisition of trademarks, partially offset by redemptions of $332.0 million of
investment securities, net of purchases.
Net cash used in financing activities for fiscal 2013 was $1.222 billion, compared with $965.4 million in fiscal 2012. The increase
in net cash used was primarily due to an increase in common stock repurchases of $282.7 million, partially offset by a
$25.5 million payment in the prior year for a credit facility assumed in connection with an acquisition.
BED BATH & BEYOND 2013 ANNUAL REPORT
9