Bed, Bath and Beyond 2013 Annual Report Download - page 37
Download and view the complete annual report
Please find page 37 of the 2013 Bed, Bath and Beyond annual report below. You can navigate through the pages in the report by either clicking on the pages listed below, or by using the keyword search tool below to find specific information within the annual report.-
 1
1 -
2
-
3
-
4
-
5
-
6
-
7
-
8
-
9
-
10
-
11
-
12
-
13
-
14
-
15
-
16
-
17
-
18
-
19
-
20
-
21
-
22
-
23
-
24
-
25
-
26
-
 27
27 -
 28
28 -
 29
29 -
 30
30 -
 31
31 -
 32
32 -
 33
33 -
 34
34 -
 35
35 -
 36
36 -
 37
37 -
 38
38 -
 39
39 -
 40
40 -
 41
41 -
 42
42 -
 43
43 -
 44
44 -
 45
45 -
 46
46 -
 47
47 -
48
-
49
-
50
-
51
-
52
-
53
-
54
-
55
-
56
-
57
-
58
-
59
-
60
-
61
-
62
-
63
-
64
-
65
-
66
-
67
-
68
-
69
-
70
-
71
-
72
-
73
-
74
-
75
-
76
-
77
-
78
-
79
-
80
 |
 |

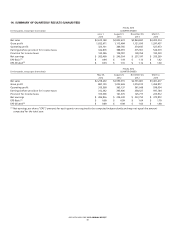
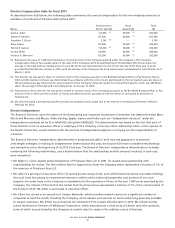
14. SUMMARY OF QUARTERLY RESULTS (UNAUDITED)
(in thousands, except per share data)
FISCAL 2013
QUARTER ENDED
June 1,
2013
August 31,
2013
November 30,
2013
March 1,
2014
Net sales $2,612,140 $2,823,672 $2,864,837 $3,203,314
Gross profit 1,032,971 1,113,484 1,121,690 1,297,437
Operating profit 323,101 389,766 374,647 527,073
Earnings before provision for income taxes 322,876 388,091 375,961 526,519
Provision for income taxes 120,386 138,787 138,764 193,220
Net earnings $ 202,490 $ 249,304 $ 237,197 $ 333,299
EPS-Basic
(1)
$ 0.94 $ 1.18 $ 1.13 $ 1.62
EPS-Diluted
(1)
$ 0.93 $ 1.16 $ 1.12 $ 1.60
(in thousands, except per share data)
FISCAL 2012
QUARTER ENDED
May 26,
2012
August 25,
2012
November 24,
2012
March 2,
2013
Net sales $2,218,292 $2,593,015 $2,701,801 $3,401,477
Gross profit 887,199 1,032,669 1,074,010 1,394,877
Operating profit 313,398 365,137 361,649 598,034
Earnings before provision for income taxes 312,342 365,406 358,527 597,784
Provision for income taxes 105,506 141,076 125,777 223,912
Net earnings $ 206,836 $ 224,330 $ 232,750 $ 373,872
EPS-Basic
(1)
$ 0.90 $ 0.99 $ 1.04 $ 1.70
EPS-Diluted
(1)
$ 0.89 $ 0.98 $ 1.03 $ 1.68
(1)
Net earnings per share (‘‘EPS’’) amounts for each quarter are required to be computed independently and may not equal the amount
computed for the total year.
BED BATH & BEYOND 2013 ANNUAL REPORT
35