Bed, Bath and Beyond 2011 Annual Report Download - page 8
Download and view the complete annual report
Please find page 8 of the 2011 Bed, Bath and Beyond annual report below. You can navigate through the pages in the report by either clicking on the pages listed below, or by using the keyword search tool below to find specific information within the annual report.-
 1
1 -
 2
2 -
 3
3 -
 4
4 -
 5
5 -
 6
6 -
 7
7 -
 8
8 -
 9
9 -
 10
10 -
 11
11 -
 12
12 -
 13
13 -
 14
14 -
 15
15 -
 16
16 -
 17
17 -
 18
18 -
 19
19 -
20
-
21
-
22
-
23
-
24
-
25
-
26
-
27
-
28
-
29
-
30
-
31
-
32
-
33
-
34
-
35
-
36
-
37
-
38
-
39
-
40
-
41
-
42
-
43
-
44
-
45
-
46
-
47
-
48
-
49
-
50
-
51
-
52
-
53
-
54
-
55
-
56
-
57
-
58
-
59
-
60
-
61
-
62
-
63
-
64
-
65
-
66
-
67
-
68
-
69
-
70
-
71
-
72
-
73
-
74
-
75
-
76
-
77
-
78
-
79
-
80
-
81
-
82
-
83
-
84
-
85
-
86
-
87
-
88
-
89
-
90
-
91
-
92
-
93
-
94
-
95
-
96
 |
 |

BED BATH & BEYOND 2011 ANNUAL REPORT
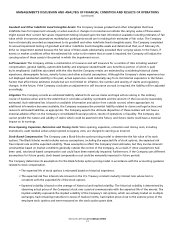
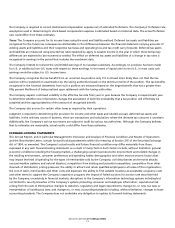
MANAGEMENT’S DISCUSSION AND ANALYSIS OF FINANCIAL CONDITION AND RESULTS OF OPERATIONS
(continued)
the increase in net earnings per diluted share primarily reflects the favorable movements in gross profit and
respectively.
The Company plans to continue to expand its operations and invest in its infrastructure to reach its long term objectives. In fiscal
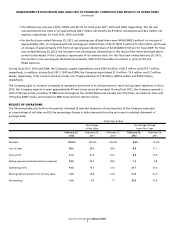
RESULTS OF OPERATIONS
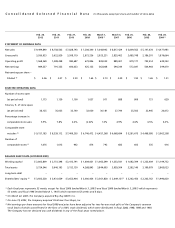
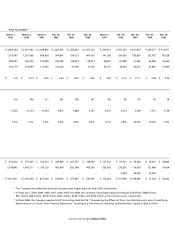
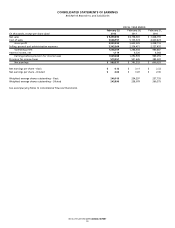
The following table sets forth for the periods indicated (i) selected statement of earnings data of the Company expressed
as a percentage of net sales and (ii) the percentage change in dollar amounts from the prior year in selected statement of
earnings data:
Fiscal Year Ended
Percentage Percentage Change
of Net Sales from Prior Year
February 25, February 25,
2012 2012
Net sales 100.0% 8.5%
Cost of sales 58.6 8.4
41.4 8.5
Selling, general and administrative expenses 24.9 1.2
Operating profit 16.5 21.7
Earnings before provision for income taxes 16.5 21.4
Net earnings 10.4 25.0