Bed, Bath and Beyond 2011 Annual Report Download - page 16
Download and view the complete annual report
Please find page 16 of the 2011 Bed, Bath and Beyond annual report below. You can navigate through the pages in the report by either clicking on the pages listed below, or by using the keyword search tool below to find specific information within the annual report.-
 1
1 -
2
-
3
-
4
-
5
-
 6
6 -
 7
7 -
 8
8 -
 9
9 -
 10
10 -
 11
11 -
 12
12 -
 13
13 -
 14
14 -
 15
15 -
 16
16 -
 17
17 -
 18
18 -
 19
19 -
 20
20 -
 21
21 -
 22
22 -
 23
23 -
 24
24 -
 25
25 -
 26
26 -
27
-
28
-
29
-
30
-
31
-
32
-
33
-
34
-
35
-
36
-
37
-
38
-
39
-
40
-
41
-
42
-
43
-
44
-
45
-
46
-
47
-
48
-
49
-
50
-
51
-
52
-
53
-
54
-
55
-
56
-
57
-
58
-
59
-
60
-
61
-
62
-
63
-
64
-
65
-
66
-
67
-
68
-
69
-
70
-
71
-
72
-
73
-
74
-
75
-
76
-
77
-
78
-
79
-
80
-
81
-
82
-
83
-
84
-
85
-
86
-
87
-
88
-
89
-
90
-
91
-
92
-
93
-
94
-
95
-
96
 |
 |

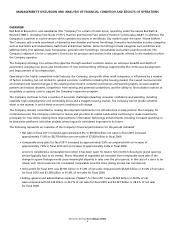
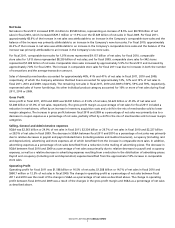
BED BATH & BEYOND 2011 ANNUAL REPORT
14
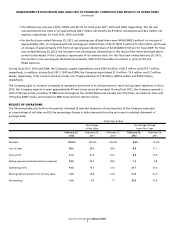
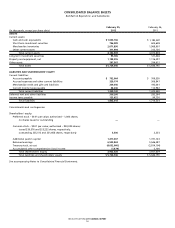
CONSOLIDATED BALANCE SHEETS
Bed Bath & Beyond Inc. and Subsidiaries
February 25, February 26,
(in thousands, except per share data) 2012 2011
ASSETS
Current assets:
Cash and cash equivalents $ 1,003,166 $
1,183,587
Short term investment securities 756,389 605,608
Merchandise inventories 2,071,890 1,968,907
Other current assets 311,494 315,736
Total current assets 4,142,939 4,073,838
Long term investment securities 95,785 121,446
Property and equipment, net 1,198,255 1,116,297
Other assets 287,567 334,612
Total assets $ 5,724,546 $ 5,646,193
LIABILITIES AND SHAREHOLDERS’ EQUITY
Current liabilities:
Accounts payable 752,064 $ 709,550
Accrued expenses and other current liabilities 329,174 306,847
Merchandise credit and gift card liabilities 209,646 193,061
Current income taxes payable 48,246 112,982
Total current liabilities 1,339,130 1,322,440
Deferred rent and other liabilities 339,266 292,364
Income taxes payable 123,622 99,730
Total liabilities 1,802,018 1,714,534
Commitments and contingencies
Shareholders’ equity:
Preferred stock – $0.01 par value; authorized – 1,000 shares;
no shares issued or outstanding — —
Common stock – $0.01 par value; authorized – 900,000 shares;
issued 330,576 and 325,222 shares, respectively;
outstanding 235,515 and 251,666 shares, respectively 3,306 3,253
Additional paid-in capital 1,417,337 1,191,123
Retained earnings 6,535,824 5,546,287
Treasury stock, at cost (4,032,060) (2,814,104)
Accumulated other comprehensive (loss) income (1,879) 5,100
Total shareholders’ equity 3,922,528 3,931,659
Total liabilities and shareholders’ equity $ 5,724,546 $ 5,646,193
See accompanying Notes to Consolidated Financial Statements.
$