Bed, Bath and Beyond 2011 Annual Report Download - page 46
Download and view the complete annual report
Please find page 46 of the 2011 Bed, Bath and Beyond annual report below. You can navigate through the pages in the report by either clicking on the pages listed below, or by using the keyword search tool below to find specific information within the annual report.-
 1
1 -
2
-
3
-
4
-
5
-
6
-
7
-
8
-
9
-
10
-
11
-
12
-
13
-
14
-
15
-
16
-
17
-
18
-
19
-
20
-
21
-
22
-
23
-
24
-
25
-
26
-
27
-
28
-
29
-
30
-
31
-
32
-
33
-
34
-
35
-
 36
36 -
 37
37 -
 38
38 -
 39
39 -
 40
40 -
 41
41 -
 42
42 -
 43
43 -
 44
44 -
 45
45 -
 46
46 -
 47
47 -
 48
48 -
 49
49 -
 50
50 -
 51
51 -
 52
52 -
 53
53 -
 54
54 -
 55
55 -
 56
56 -
57
-
58
-
59
-
60
-
61
-
62
-
63
-
64
-
65
-
66
-
67
-
68
-
69
-
70
-
71
-
72
-
73
-
74
-
75
-
76
-
77
-
78
-
79
-
80
-
81
-
82
-
83
-
84
-
85
-
86
-
87
-
88
-
89
-
90
-
91
-
92
-
93
-
94
-
95
-
96
 |
 |

BED BATH & BEYOND PROXY STATEMENT
44
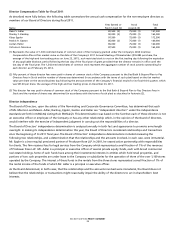
EXECUTIVE COMPENSATION
Compensation Discussion and Analysis
The following is a discussion and analysis of our compensation programs as they apply to the Company’s principal executive
officer, principal financial officer and the three most highly compensated executive officers of the Company (other than its
principal executive officer and principal financial officer) for fiscal 2011 (“named executive officers”) whose compensation
information is presented in the Summary Compensation Table and other tables following this discussion and analysis.
Overview of Executive Compensation
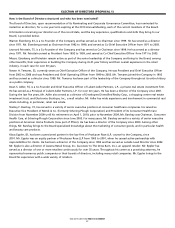
As described below, the Company has experienced strong growth and financial stability in the 41 years of its existence and, in
particular, in the 20 years since it became a public company. The Company believes that a key factor in this performance has
been the stability of its executive team. Including Warren Eisenberg and Leonard Feinstein, the Company’s Co-Chairmen and
Co-Founders, each of whom has served the Company’s business for over 40 years, the Company’s executive officers have an
average tenure with the Company of over 30 years. The Company’s policy is to seek, at all levels, to promote from within. Thus,
the Company has been managed by a cohesive group of executives who have worked together for many years.
The Compensation Committee’s principal objective is to develop and implement compensation policies to retain this successful
executive group, while at the same time aligning the executives’ compensation with the Company’s performance and
enhancements to shareholder value. The cash compensation levels for our named executive officers (our Co-Chairmen, Chief
Executive Officer, President and Chief Financial Officer) and the other executive officers whose compensation is determined
the Company has no bonus program for these executives or the other executives whose compensation is determined by the
Compensation Committee. The Compensation Committee places greater emphasis on equity compensation, consisting of stock
options and restricted stock. Further, the Company’s equity compensation programs include substantial time vesting provisions
which provide greater incentives for the executives to remain with the Company and to focus on the Company’s performance
over an extended period.
Since the initial public offering of its common stock in 1992 through the end of fiscal 2011, the Company has experienced an
average annual growth in revenues of 22.0%, net income of 24.3% and net earnings per diluted share of 24.8%. As a result of
this growth, the Company was added to the NASDAQ-100 Index in the fourth quarter of fiscal 1996 and the S&P 500 Index in
the third quarter of fiscal 1999 and has maintained these positions since those years. The Company is listed as the 294th largest
company in the United States as measured by revenue on the 2012 Fortune 500 annual ranking of America’s largest corporations.
Since the initial public offering of its common stock in 1992 through the end of fiscal 2011, the Company’s stock price has
increased at an average annual rate of 22.4%.
For fiscal 2010, the Company reported net earnings of $3.07 per diluted share ($791.3 million), an increase of approximately 33%
Based on the recommendations and data from James F. Reda & Associates LLC (“JFR”), the independent compensation consultant
retained by the Compensation Committee, and other factors, and in light of the Company’s strong financial results for fiscal 2010
(as described above), the Compensation Committee determined that the named executive officers of the Company should receive
the total compensation packages for fiscal 2011, as further described below.
as compared with net earnings of $2.30 per diluted share ($600.0 million) for the fiscal year ended February 27, 2010 (“fiscal 2009“).
In addition, for fiscal 2011, the Company reported net earnings of $4.06 per diluted share ($989.5 million), an increase of
approximately 32% as compared with fiscal 2010.