Bed, Bath and Beyond 2011 Annual Report Download - page 32
Download and view the complete annual report
Please find page 32 of the 2011 Bed, Bath and Beyond annual report below. You can navigate through the pages in the report by either clicking on the pages listed below, or by using the keyword search tool below to find specific information within the annual report.-
 1
1 -
2
-
3
-
4
-
5
-
6
-
7
-
8
-
9
-
10
-
11
-
12
-
13
-
14
-
15
-
16
-
17
-
18
-
19
-
20
-
21
-
 22
22 -
 23
23 -
 24
24 -
 25
25 -
 26
26 -
 27
27 -
 28
28 -
 29
29 -
 30
30 -
 31
31 -
 32
32 -
 33
33 -
 34
34 -
 35
35 -
 36
36 -
 37
37 -
 38
38 -
 39
39 -
 40
40 -
 41
41 -
 42
42 -
43
-
44
-
45
-
46
-
47
-
48
-
49
-
50
-
51
-
52
-
53
-
54
-
55
-
56
-
57
-
58
-
59
-
60
-
61
-
62
-
63
-
64
-
65
-
66
-
67
-
68
-
69
-
70
-
71
-
72
-
73
-
74
-
75
-
76
-
77
-
78
-
79
-
80
-
81
-
82
-
83
-
84
-
85
-
86
-
87
-
88
-
89
-
90
-
91
-
92
-
93
-
94
-
95
-
96
 |
 |

BED BATH & BEYOND 2011 ANNUAL REPORT
30
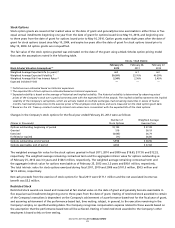
Changes in the Company’s restricted stock for the fiscal year ended February 25, 2012 were as follows:
Weighted Average
Number of Grant-Date
(Shares in thousands) Restricted Shares Fair Value
Unvested restricted stock, beginning of period 4,575 $ 35.58
Granted 901 56.03
Vested (860) 35.90
Forfeited (195) 38.83
Unvested restricted stock, end of period 4,421 $ 39.54
13. SUMMARY OF QUARTERLY RESULTS (UNAUDITED)
FISCAL 2011
(in thousands, except per share data) QUARTER ENDED
May 28, August 27, November 26, February 25,
2011 2011 2011 2012
Net sales $ 2,109,951 $ 2,314,064 $ 2,343,561 $ 2,732,314
Gross profit 857,572 950,999 958,693 1,163,669
Operating profit 288,948 371,636 357,020 550,765
Earnings before provision for income taxes 289,500 369,764 356,418 553,806
Provision for income taxes 108,922 140,392 127,874 202,763
Net earnings $ 180,578 $ 229,372 $ 228,544 $ 351,043
EPS-Basic (1) $ 0.74 $ 0.94 $ 0.96 $ 1.50
EPS-Diluted (1) $ 0.72 $ 0.93 $ 0.95 $ 1.48
FISCAL 2010
(in thousands, except per share data) QUARTER ENDED
May 29, August 28, November 27, February 26,
2010 2010 2010 2011
Net sales $ 1,923,051 $ 2,136,730 $ 2,193,755 $ 2,504,967
Gross profit 775,036 874,918 896,508 1,076,467
Operating profit 225,394 296,902 305,110 461,052
Earnings before provision for income taxes 225,910 297,229 307,106 462,733
Provision for income taxes 88,357 115,474 118,532 179,282
Net earnings $ 137,553 $ 181,755 $ 188,574 $ 283,451
EPS-Basic (1) $ 0.53 $ 0.71 $ 0.75 $ 1.14
EPS-Diluted (1) $ 0.52 $ 0.70 $ 0.74 $ 1.12
(1) Net earnings per share (“EPS”) amounts for each quarter are required to be computed independently and may not equal the amount
computed for the total year.
NOTES TO CONSOLIDATED FINANCIAL STATEMENTS
(continued)