Bed, Bath and Beyond 2011 Annual Report Download - page 27
Download and view the complete annual report
Please find page 27 of the 2011 Bed, Bath and Beyond annual report below. You can navigate through the pages in the report by either clicking on the pages listed below, or by using the keyword search tool below to find specific information within the annual report.-
 1
1 -
2
-
3
-
4
-
5
-
6
-
7
-
8
-
9
-
10
-
11
-
12
-
13
-
14
-
15
-
16
-
 17
17 -
 18
18 -
 19
19 -
 20
20 -
 21
21 -
 22
22 -
 23
23 -
 24
24 -
 25
25 -
 26
26 -
 27
27 -
 28
28 -
 29
29 -
 30
30 -
 31
31 -
 32
32 -
 33
33 -
 34
34 -
 35
35 -
 36
36 -
 37
37 -
38
-
39
-
40
-
41
-
42
-
43
-
44
-
45
-
46
-
47
-
48
-
49
-
50
-
51
-
52
-
53
-
54
-
55
-
56
-
57
-
58
-
59
-
60
-
61
-
62
-
63
-
64
-
65
-
66
-
67
-
68
-
69
-
70
-
71
-
72
-
73
-
74
-
75
-
76
-
77
-
78
-
79
-
80
-
81
-
82
-
83
-
84
-
85
-
86
-
87
-
88
-
89
-
90
-
91
-
92
-
93
-
94
-
95
-
96
 |
 |

BED BATH & BEYOND 2011 ANNUAL REPORT
25
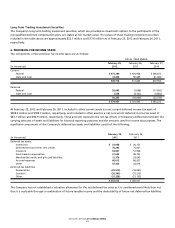
Long Term Trading Investment Securities
The Company’s long term trading investment securities, which are provided as investment options to the participants of the
nonqualified deferred compensation plan, are stated at fair market value. The values of these trading investment securities
included in the table above are approximately $22.1 million and $17.6 million as of February 25, 2012 and February 26, 2011,
respectively.
6. PROVISION FOR INCOME TAXES
The components of the provision for income taxes are as follows:
FISCAL YEAR ENDED
February 25, February 26, February 27,
(in thousands) 2012 2011 2010
Current:
Federal $ 475,280 $ 426,956 $ 346,875
State and local 74,438 90,689 61,080
549,718 517,645 407,955
Deferred:
Federal 28,695 (7,698) (17,851)
State and local 1,538 (8,302) (4,882)
30,233 (16,000) (22,733)
$ 579,951 $ 501,645 $ 385,222
At February 25, 2012 and February 26, 2011, included in other current assets is a net current deferred income tax asset of
$209.4 million and $189.1 million, respectively, and included in other assets is a net noncurrent deferred income tax asset of
$43.7 million and $90.9 million, respectively. These amounts represent the net tax effects of temporary differences between the
carrying amounts of assets and liabilities for financial reporting purposes and the amounts used for income tax purposes. The
significant components of the Company’s deferred tax assets and liabilities consist of the following:
February 25, February 26,
(in thousands) 2012 2011
Deferred tax assets:
Inventories $ 33,058 $ 26,151
Deferred rent and other rent credits 78,292 75,007
Insurance 53,607 51,906
Stock-based compensation 37,633 48,743
Merchandise credits and gift card liabilities 12,376 29,043
Accrued expenses 80,012 86,927
Other 47,422 33,616
Deferred tax liabilities:
Depreciation (25,510) (18,991)
Goodwill (36,590) (31,213)
Other (27,228) (21,152)
$ 253,072 $ 280,037
The Company has not established a valuation allowance for the net deferred tax asset as it is considered more likely than not
that it is realizable through a combination of future taxable income and the deductibility of future net deferred tax liabilities.