Bed, Bath and Beyond 2011 Annual Report Download - page 52
Download and view the complete annual report
Please find page 52 of the 2011 Bed, Bath and Beyond annual report below. You can navigate through the pages in the report by either clicking on the pages listed below, or by using the keyword search tool below to find specific information within the annual report.-
 1
1 -
2
-
3
-
4
-
5
-
6
-
7
-
8
-
9
-
10
-
11
-
12
-
13
-
14
-
15
-
16
-
17
-
18
-
19
-
20
-
21
-
22
-
23
-
24
-
25
-
26
-
27
-
28
-
29
-
30
-
31
-
32
-
33
-
34
-
35
-
36
-
37
-
38
-
39
-
40
-
41
-
 42
42 -
 43
43 -
 44
44 -
 45
45 -
 46
46 -
 47
47 -
 48
48 -
 49
49 -
 50
50 -
 51
51 -
 52
52 -
 53
53 -
 54
54 -
 55
55 -
 56
56 -
 57
57 -
 58
58 -
 59
59 -
 60
60 -
 61
61 -
 62
62 -
63
-
64
-
65
-
66
-
67
-
68
-
69
-
70
-
71
-
72
-
73
-
74
-
75
-
76
-
77
-
78
-
79
-
80
-
81
-
82
-
83
-
84
-
85
-
86
-
87
-
88
-
89
-
90
-
91
-
92
-
93
-
94
-
95
-
96
 |
 |

BED BATH & BEYOND PROXY STATEMENT
50
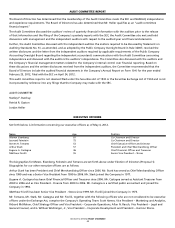
COMPENSATION COMMITTEE REPORT
The Compensation Committee of the Company’s Board of Directors has submitted the following report for inclusion
in this Proxy Statement:
The Compensation Committee has reviewed and discussed with management the Compensation Discussion and Analysis
contained in this Proxy Statement. Based on the Compensation Committee’s review of and the discussions with management with
respect to the Compensation Discussion and Analysis, the Compensation Committee recommended to the Board of Directors that
the Compensation Discussion and Analysis be included in this Proxy Statement and incorporated by reference in the Company’s
Annual Report on Form 10-K for fiscal 2011 for filing with the SEC.
The foregoing report is provided by the following directors, who constitute the Compensation Committee:
COMPENSATION COMMITTEE
Dean S. Adler
Klaus Eppler
Victoria A. Morrison
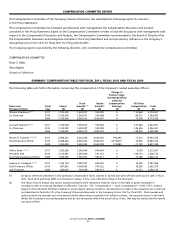
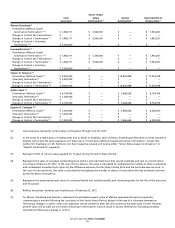
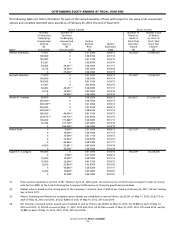
SUMMARY COMPENSATION TABLE FOR FISCAL 2011, FISCAL 2010 AND FISCAL 2009
The following table sets forth information concerning the compensation of the Company’s named executive officers.
Change in
Pension Value
and Nonqualified
Deferred
Stock Option Compensation All Other
Name and Fiscal Salary(1) Awards Awards(2) Earnings Compensation Total
Principal Position Year ($) ($) ($) ($) ($) ($)
Warren Eisenberg (4) (5) 2011 1,100,000 1,500,027 500,000 0 115,564 3,215,591
Co-Chairman 2010 1,100,000 1,500,007 500,008 0 80,072 3,180,087
2009 1,100,000 2,000,013 1,000,007 0 73,518 4,173,538
Leonard Feinstein (6) (7) 2011 1,100,000 1,500,027 500,000 0 123,264 3,223,291
Co-Chairman 2010 1,100,000 1,500,007 500,008 0 146,326 3,246,341
2009 1,100,000 2,000,013 1,000,007 0 138,476 4,238,496
Steven H. Temares (8) (9) (10) 2011 2,894,231 5,225,036 5,000,003 790,392 17,572 13,927,234
Chief Executive Officer 2010 2,288,462 4,500,022 4,500,007 4,179,870 15,052 15,483,413
2009 1,500,000 3,500,002 3,500,008 175,889 21,129 8,697,028
Arthur Stark (11) (12) 2011 1,353,558 1,250,004 600,000 0 9,729 3,213,291
President and 2010 1,212,692 1,250,006 547,322 0 196,713 3,206,733
Chief Merchandising Officer 2009 1,055,000 1,000,021 590,011 0 17,182 2,662,214
Eugene A. Castagna (13) (14) 2011 1,166,154 1,000,037 600,000 0 15,395 2,781,586
Chief Financial Officer 2010 997,692 1,000,005 547,322 0 18,355 2,563,374
and Treasurer 2009 840,000 750,008 590,011 0 14,151 2,194,170
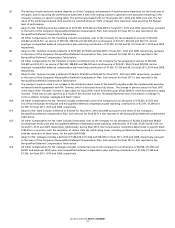
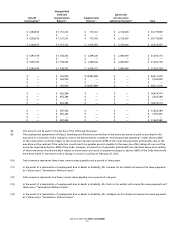
(1)
Except as otherwise described in this Summary Compensation Table, salaries to named executive officers were paid in cash in fiscal
2011, fiscal 2010 and fiscal 2009, and increases in salary, if any, were effective in May of the fiscal year.
(2)
The value of stock awards and option awards represents their respective total fair value on the date of grant calculated in
accordance with Accounting Standards Codification Topic No. 718, “Compensation — Stock Compensation” (“ASC 718”), without
regard to the estimated forfeiture related to service-based vesting conditions. All assumptions made in the valuations are contained
and described in footnote 12 to the Company’s financial statements in the Company’s Form 10-K for fiscal 2011. Stock awards and
option awards are rounded up to the nearest whole share when converted from dollars to shares. The amounts shown in the table
reflect the Company’s accounting expense and do not necessarily reflect the actual value, if any, that may be realized by the named
executive officers.