Bed, Bath and Beyond 2011 Annual Report Download - page 21
Download and view the complete annual report
Please find page 21 of the 2011 Bed, Bath and Beyond annual report below. You can navigate through the pages in the report by either clicking on the pages listed below, or by using the keyword search tool below to find specific information within the annual report.BED BATH & BEYOND 2011 ANNUAL REPORT
19
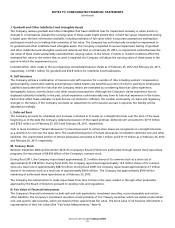
Those investment securities which the Company has the ability and intent to hold until maturity are classified as held-to-
maturity investments and are stated at amortized cost. Those investment securities which are bought and held principally for
the purpose of selling them in the near term are classified as trading securities and are stated at fair market value.
Premiums are amortized and discounts are accreted over the life of the security as adjustments to interest income using the
effective interest method. Dividend and interest income are recognized when earned.
G. Inventory Valuation
Merchandise inventories are stated at the lower of cost or market. Inventory costs for BBB, buybuy BABY and Harmon
are calculated using the weighted average retail inventory method and inventory costs for CTS are calculated using the first
in first out cost method.
Under the retail inventory method, the valuation of inventories at cost and the resulting gross margins are calculated by
applying a cost-to-retail ratio to the retail values of inventories. The cost associated with determining the cost-to-retail ratio
includes: merchandise purchases, net of returns to vendors, discounts and volume and incentive rebates; inbound freight
expenses; duty, insurance and commissions.
At any one time, inventories include items that have been written down to the Company’s best estimate of their realizable
value. Judgment is required in estimating realizable value and factors considered are the age of merchandise and anticipated
demand. Actual realizable value could differ materially from this estimate based upon future customer demand or economic
conditions.
The Company estimates its reserve for shrinkage throughout the year based on historical shrinkage and any current trends,
if applicable. Actual shrinkage is recorded at year end based upon the results of the Company’s physical inventory counts for
locations at which counts were conducted. For locations where physical inventory counts were not conducted in the fiscal year,
an estimated shrink reserve is recorded based on historical shrinkage and any current trends, if applicable. Historically, the
Company’s shrinkage has not been volatile.
The Company accrues for merchandise in transit once it takes legal ownership and title to the merchandise; as such, an estimate
for merchandise in transit is included in the Company’s merchandise inventories.
H. Property and Equipment
Property and equipment are stated at cost. Depreciation is computed primarily using the straight-line method over the
estimated useful lives of the assets (forty years for buildings; five to twenty years for furniture, fixtures and equipment; and
three to seven years for computer equipment and software). Leasehold improvements are amortized using the straight-line
method over the lesser of their estimated useful life or the life of the lease. Depreciation expense is primarily included within
selling, general and administrative expenses.
The cost of maintenance and repairs is charged to earnings as incurred; significant renewals and betterments are capitalized.
Maintenance and repairs amounted to $85.8 million, $90.2 million and $86.2 million for fiscal 2011, 2010 and 2009, respectively.
I. Impairment of Long-Lived Assets
The Company reviews long-lived assets for impairment when events or changes in circumstances indicate the carrying value
of these assets may exceed their current fair values. Recoverability of assets to be held and used is measured by a comparison
of the carrying amount of an asset to the estimated undiscounted future cash flows expected to be generated by the asset. If
the carrying amount of an asset exceeds its estimated future cash flows, an impairment charge is recognized for the amount
by which the carrying amount of the asset exceeds the fair value of the assets. Assets to be disposed of would be separately
presented in the balance sheet and reported at the lower of the carrying amount or fair value less costs to sell, and are no
longer depreciated. The assets and liabilities of a disposal group classified as held for sale would be presented separately
in the appropriate asset and liability sections of the balance sheet. The Company has not historically recorded any material
impairment to its long-lived assets. In the future, if events or market conditions affect the estimated fair value to the extent
that a long-lived asset is impaired, the Company will adjust the carrying value of these long-lived assets in the period in which
the impairment occurs.


