Bed, Bath and Beyond 2011 Annual Report Download - page 26
Download and view the complete annual report
Please find page 26 of the 2011 Bed, Bath and Beyond annual report below. You can navigate through the pages in the report by either clicking on the pages listed below, or by using the keyword search tool below to find specific information within the annual report.-
 1
1 -
2
-
3
-
4
-
5
-
6
-
7
-
8
-
9
-
10
-
11
-
12
-
13
-
14
-
15
-
 16
16 -
 17
17 -
 18
18 -
 19
19 -
 20
20 -
 21
21 -
 22
22 -
 23
23 -
 24
24 -
 25
25 -
 26
26 -
 27
27 -
 28
28 -
 29
29 -
 30
30 -
 31
31 -
 32
32 -
 33
33 -
 34
34 -
 35
35 -
 36
36 -
37
-
38
-
39
-
40
-
41
-
42
-
43
-
44
-
45
-
46
-
47
-
48
-
49
-
50
-
51
-
52
-
53
-
54
-
55
-
56
-
57
-
58
-
59
-
60
-
61
-
62
-
63
-
64
-
65
-
66
-
67
-
68
-
69
-
70
-
71
-
72
-
73
-
74
-
75
-
76
-
77
-
78
-
79
-
80
-
81
-
82
-
83
-
84
-
85
-
86
-
87
-
88
-
89
-
90
-
91
-
92
-
93
-
94
-
95
-
96
 |
 |

BED BATH & BEYOND 2011 ANNUAL REPORT
24
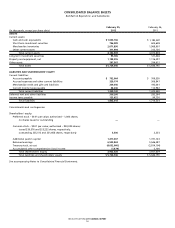
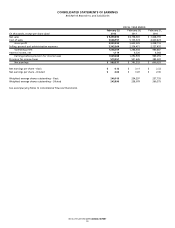
NOTES TO CONSOLIDATED FINANCIAL STATEMENTS
(continued)
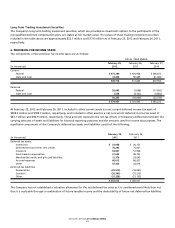
The following table presents the changes in the Company’s financial assets that are measured at fair value on a recurring
basis using significant unobservable inputs (Level 3):
Auction Rate
(in millions) Securities
Balance on February 26, 2011, net of temporary valuation adjustment $ 109.7
Change in temporary valuation adjustment included in accumulated
other comprehensive (loss) income (0.5)
Redemptions at par (29.0)
Balance on February 25, 2012, net of temporary valuation adjustment $ 80.2
Subsequent to the end of fiscal 2011 through April 13, 2012, the Company additionally redeemed approximately $6.5 million of
short term available-for-sale securities at par.
5. INVESTMENT SECURITIES
The Company’s investment securities as of February 25, 2012 and February 26, 2011 are as follows:
February 25, February 26,
(in millions) 2012 2011
Available-for-sale securities:
Short term $ 6.5 $ 5.8
Long term 73.7 103.9
Trading securities:
Long term 22.1 17.6
Held-to-maturity securities:
Short term 749.9 599.8
Total investment securities $ 852.2 $ 727.1
Auction Rate Securities
As of February 25, 2012 and February 26, 2011, the Company’s available-for-sale investment securities represented approximately
$83.9 million and approximately $112.9 million par value of auction rate securities, respectively, less temporary valuation
adjustments of approximately $3.7 million and $3.2 million, respectively. Since these valuation adjustments are deemed to be
temporary, they are recorded in accumulated other comprehensive (loss) income, net of a related tax benefit, and did not affect
the Company’s net earnings. These securities at par are invested in preferred shares of closed end municipal bond funds, which
are required, pursuant to the Investment Company Act of 1940, to maintain minimum asset coverage ratios of 200%. All of these
available-for-sale investments carried triple-A credit ratings from one or more of the major credit rating agencies as of February
25, 2012 and February 26, 2011, and none of them are mortgage-backed debt obligations. As of February 25, 2012 and February
26, 2011, the Company’s available-for-sale investments have been in a continuous unrealized loss position for 12 months or more,
however, the Company believes that the unrealized losses are temporary and reflect the investments’ current lack of liquidity. Due
to their lack of liquidity, the Company classified approximately $73.7 million and $103.9 million of these investments as long term
investment securities at February 25, 2012 and February 26, 2011, respectively. During fiscal 2011, approximately $29.0 million of
these securities were redeemed at par.
Subsequent to the end of fiscal 2011 through April 13, 2012, the Company redeemed approximately $6.5 million of short term
available-for-sale securities at par.
U.S. Treasury Securities
As of February 25, 2012 and February 26, 2011, the Company’s short term held-to-maturity securities included approximately
$749.9 million and approximately $599.8 million, respectively, of U.S. Treasury Bills with remaining maturities of less than one year.
These securities are stated at their amortized cost which approximates fair value.