Bed, Bath and Beyond 2008 Annual Report Download - page 8
Download and view the complete annual report
Please find page 8 of the 2008 Bed, Bath and Beyond annual report below. You can navigate through the pages in the report by either clicking on the pages listed below, or by using the keyword search tool below to find specific information within the annual report.-
 1
1 -
 2
2 -
 3
3 -
 4
4 -
 5
5 -
 6
6 -
 7
7 -
 8
8 -
 9
9 -
 10
10 -
 11
11 -
 12
12 -
 13
13 -
 14
14 -
 15
15 -
 16
16 -
 17
17 -
 18
18 -
 19
19 -
20
-
21
-
22
-
23
-
24
-
25
-
26
-
27
-
28
-
29
-
30
-
31
-
32
-
33
-
34
-
35
-
36
-
37
-
38
-
39
-
40
-
41
-
42
-
43
-
44
-
45
-
46
-
47
-
48
-
49
-
50
-
51
-
52
-
53
-
54
-
55
-
56
-
57
-
58
-
59
-
60
-
61
-
62
-
63
-
64
-
65
-
66
-
67
-
68
-
69
-
70
-
71
-
72
-
73
-
74
-
75
-
76
-
77
-
78
-
79
-
80
 |
 |

BED BATH & BEYOND 2008 ANNUAL REPORT
6
EXPANSION PROGRAM
The Company is engaged in an ongoing expansion program involving the opening of new stores in both new and existing mar-
kets, the expansion or relocation of existing stores and the continuous review of strategic acquisitions. In the 17 year period from
the beginning of fiscal 1992 to the end of fiscal 2008, the chain has grown from 34 to 1,037 stores. Total square footage grew
from 0.9 million square feet at the beginning of fiscal 1992 to 32.1 million square feet at the end of fiscal 2008. During fiscal 2008,
the Company opened a total of 67 new stores, including 49 BBB stores throughout the United States and Canada, 11 CTS stores,
one Harmon store and six buybuy BABY stores, and closed one Harmon store, all of which resulted in the aggregate addition of
approximately 1.9 million square feet of store space. The Company opened its first international BBB store in Ontario, Canada in
December 2007 and opened three additional stores in Canada during fiscal 2008. Since May 2008, the Company, through a joint
venture, operates two stores in Mexico under the name “Home & More.”
The Company plans to continue to expand its operations and invest in its infrastructure to reach its long-term objectives. In fiscal
2009, the Company expects to open approximately 50 to 54 new stores, including approximately 35 BBB stores throughout the
United States and Canada, approximately six to eight CTS stores, approximately eight to ten buybuy BABY stores and one Harmon
store. The Company currently has no outstanding bank borrowings, and for fiscal 2009, expects its operations to be entirely fund-
ed from internally generated sources.
LIQUIDITY AND CAPITAL RESOURCES
Fiscal 2008 compared to Fiscal 2007
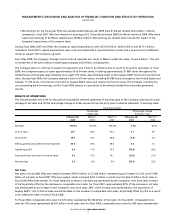
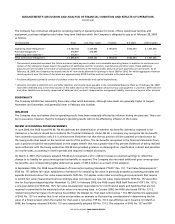
The Company has been able to finance its operations, including its expansion program, through internally generated funds. Net
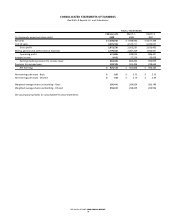
cash provided by operating activities in fiscal 2008 was $584.0 million, compared with $614.5 million in fiscal 2007. Year over year,
the Company experienced a decrease in cash provided by net earnings, partially offset by lower cash used for the net components
of working capital (primarily income taxes payable and merchandise inventories offset by merchandise credit and gift card liabili-
ties and accrued expenses and other current liabilities).
Inventoryper square foot was $51.24 as of February 28, 2009, a decrease of approximately 4.4% from $53.58 as of March 1, 2008.
The Company continues to focus on optimizing inventory productivity while maintaining appropriate in-store merchandise levels
to support sales.
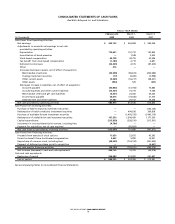
Net cash used in investing activities in fiscal 2008 was $113.1 million, compared with net cash provided by investing activities of
$101.7 million in fiscal 2007. In fiscal 2008, net cash used in investing activities was primarily due to $215.9 million of capital
expenditures partially offset by $107.6 million of redemptions of investment securities. In fiscal 2007, net cash provided by invest-
ing activities was due to $545.8 million of redemptions of investment securities, net of purchases, partially offset by $358.2 million
of capital expenditures and $85.9 million in payment for the acquisition of buybuy BABY.
Net cash used in financing activities in fiscal 2008 was $26.8 million, compared with $705.5 million in fiscal 2007. The decrease in
net cash used in financing activities was primarily attributable to a decrease in common stock repurchases in the current year.
Fiscal 2007 compared to Fiscal 2006
Net cash provided by operating activities in fiscal 2007 was $614.5 million, compared with $613.6 million in fiscal 2006. Year over
year, the Company experienced an increase in cash provided by net earnings, as adjusted for non-cash expenses (primarily
deferred taxes and depreciation), which was offset by a decrease in the net components of working capital (primarily decreases
in accounts payable and income taxes offset by an increase in merchandise inventories).
Inventory per square foot was $53.58 and $54.18 as of March 1, 2008 and March 3, 2007, respectively.
Net cash provided by investing activities in fiscal 2007 was $101.7 million, compared with net cash used in investing activities
of $397.7 million in fiscal 2006. The increase in net cash provided by investing activities was attributable to an increase in the
redemptions of investment securities, net of purchases, that was partially offset by the payment of $85.9 million for the acquisi-
tion of buybuy BABY and an increase in capital expenditures to $358.2 million in fiscal 2007 from $317.5 million in fiscal 2006.
MANAGEMENT’S DISCUSSION AND ANALYSIS OF FINANCIAL CONDITION AND RESULTS OF OPERATIONS
(continued)