Bed, Bath and Beyond 2008 Annual Report Download - page 28
Download and view the complete annual report
Please find page 28 of the 2008 Bed, Bath and Beyond annual report below. You can navigate through the pages in the report by either clicking on the pages listed below, or by using the keyword search tool below to find specific information within the annual report.-
 1
1 -
2
-
3
-
4
-
5
-
6
-
7
-
8
-
9
-
10
-
11
-
12
-
13
-
14
-
15
-
16
-
17
-
 18
18 -
 19
19 -
 20
20 -
 21
21 -
 22
22 -
 23
23 -
 24
24 -
 25
25 -
 26
26 -
 27
27 -
 28
28 -
 29
29 -
 30
30 -
 31
31 -
 32
32 -
 33
33 -
 34
34 -
 35
35 -
 36
36 -
 37
37 -
 38
38 -
39
-
40
-
41
-
42
-
43
-
44
-
45
-
46
-
47
-
48
-
49
-
50
-
51
-
52
-
53
-
54
-
55
-
56
-
57
-
58
-
59
-
60
-
61
-
62
-
63
-
64
-
65
-
66
-
67
-
68
-
69
-
70
-
71
-
72
-
73
-
74
-
75
-
76
-
77
-
78
-
79
-
80
 |
 |

BED BATH & BEYOND 2008 ANNUAL REPORT
26
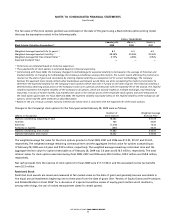
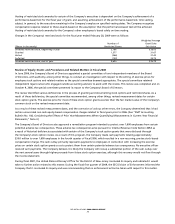
The following table presents the valuation of the Company’s financial assets as of February 28, 2009 measured at fair value on a
recurring basis by the input levels prescribed by SFAS No. 157:
Quoted Prices Significant
in Active Markets Unobservable
for Identical Assets Inputs
(in millions) (Level 1) (Level 3) Total
Short term - available-for-sale securities $ 2.0 $ — $ 2.0
Long term - available-for-sale securities — 171.4 171.4
Long term - trading securities 6.4 41.4 47.8
Long term - put option — 1.8 1.8
Total $ 8.4 $ 214.6 $ 223.0
The following table presents the changes in the Company’s financial assets that are measured at fair value on a recurring basis
using significant unobservable inputs (Level 3):
Significant
Unobservable
(in millions) Inputs (Level 3)
Balance on March 2, 2008, net of temporary valuation adjustment $ 319.5
Change in temporary valuation adjustment included in accumulated other comprehensive loss 4.7
Unrealized loss included in earnings (1) (1.8)
Recognition of Put Option 1.8
Redemptions at par (107.6)
Transfers to Level 1 (2.0)
Balance on February 28, 2009, net of temporary valuation adjustment $ 214.6
(1) Represents the amount of total losses for the period included in earnings relating to assets still held on February 28, 2009.
Subsequent to the end of fiscal 2008 through April 20, 2009, the Company additionally redeemed approximately $1.1 million of
shortterm available-for-sale securities at par.
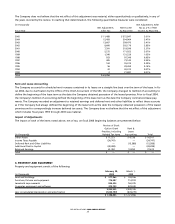
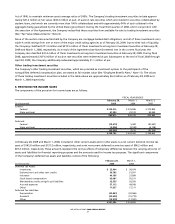
7. INVESTMENT SECURITIES
The Company’sinvestment securities as of February28, 2009 and March 1, 2008 areas follows:
February28, March 1,
(in millions) 2009 2008
Available-for-sale securities:
Shortterm $2.0 $ —
Long term 171.4 319.5
Trading Securities:
Long term 47.8 6.4
Held-to-maturity securities:
Long term 0.1 0.1
Put option - Long term 1.8 —
Total investment securities $223.1 $326.0
Auction Rate Securities
As of February 28, 2009, the Company’s available-for-sale investment securities represented approximately $176.0 million par value
of auction rate securities, less a temporaryvaluation adjustment of approximately $2.6 million to reflect their current lack of
liquidity. Since this valuation adjustment is deemed to be temporary it was recorded in accumulated other comprehensive loss, net
of a related tax benefitof approximately $1.0 million, and did not affect the Company’s earnings in fiscal 2008. These securities at
par areinvested in preferred shares of closed end municipal bond funds, which are required, pursuant to the Investment Company
NOTES TO CONSOLIDATED FINANCIAL STATEMENTS
(continued)