Bed, Bath and Beyond 2008 Annual Report Download - page 34
Download and view the complete annual report
Please find page 34 of the 2008 Bed, Bath and Beyond annual report below. You can navigate through the pages in the report by either clicking on the pages listed below, or by using the keyword search tool below to find specific information within the annual report.-
 1
1 -
2
-
3
-
4
-
5
-
6
-
7
-
8
-
9
-
10
-
11
-
12
-
13
-
14
-
15
-
16
-
17
-
18
-
19
-
20
-
21
-
22
-
23
-
 24
24 -
 25
25 -
 26
26 -
 27
27 -
 28
28 -
 29
29 -
 30
30 -
 31
31 -
 32
32 -
 33
33 -
 34
34 -
 35
35 -
 36
36 -
 37
37 -
 38
38 -
 39
39 -
 40
40 -
 41
41 -
 42
42 -
 43
43 -
 44
44 -
45
-
46
-
47
-
48
-
49
-
50
-
51
-
52
-
53
-
54
-
55
-
56
-
57
-
58
-
59
-
60
-
61
-
62
-
63
-
64
-
65
-
66
-
67
-
68
-
69
-
70
-
71
-
72
-
73
-
74
-
75
-
76
-
77
-
78
-
79
-
80
 |
 |

BED BATH & BEYOND 2008 ANNUAL REPORT
32
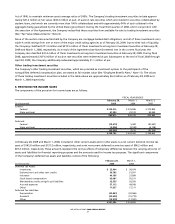
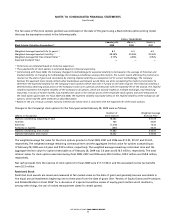
The fair value of the stock options granted was estimated on the date of the grant using a Black-Scholes option-pricing model
that uses the assumptions noted in the following table.
FISCAL YEAR ENDED
February 28, March 1, March 3,
Black-Scholes Valuation Assumptions (1) 2009 2008 2007
Weighted Average Expected Life (in years) (2) 6.1 6.4 6.3
Weighted Average Expected Volatility (3) 34.13% 25.00% 25.00%
Weighted Average Risk Free Interest Rates (4) 3.17% 4.58% 4.95%
Expected Dividend Yield ———
(1) Forfeitures are estimated based on historical experience.
(2) The expected life of stock options is estimated based on historical experience.
(3) Commencing with fiscal 2008, the Company changed its methodology for expected volatility to be based on the average of historical and
implied volatility.In changing its methodology, the Company considered, among other factors, the current events affecting the market envi-
ronment at the date of grant and consistency by utilizing implied volatility as a component of its current methodology. The Company
believes this approach more closely reflects what marketplace participants would likely use when considering the market environment to
determine the expected volatility for the Company’s stock options (which vest over 3-7 years) on the date of grant. The historical volatility is
determined by observing actual prices of the Company’s stock over a period commensurate with the expected life of the awards. The implied
volatility represents the implied volatility of the Company’scall options, which areactively traded on multiple exchanges, had remaining
maturities in excess of twelve months, had market prices close to the exercise prices of the employee stock options and were measured on
the stock option grant date. For fiscal 2007 and 2006, the expected volatility was based solely on the implied volatility of the Company’s call
options, which had the same attributes as described above.
(4) Based on the U.S. Treasury constant maturity interest rate whose term is consistent with the expected life of the stock options.
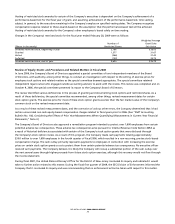
Changes in the Company’sstock options for the fiscal year ended February 28, 2009 were as follows:
Number of Weighted Average
(Shares in thousands) Stock Options Exercise Price
Options outstanding, beginning of year 18,382)$ 31.29
Granted 783)32.87
Exercised (1,218) 14.33
Forfeited or expired (465) 36.30
Options outstanding, end of year 17,482)$ 32.41
Options exercisable, end of year 13,042)$ 30.85
The weighted average fair value for the stock options granted in fiscal 2008, 2007 and 2006 was $12.95, $15.07 and $14.24,
respectively. The weighted average remaining contractual term and the aggregate intrinsic value for options outstanding as
of February 28, 2009 was 3.4 years and $18.5 million, respectively. The weighted average remaining contractual term and the
aggregate intrinsic value for options exercisable as of February 28, 2009 was 3.0 years and $18.5 million, respectively. The total
intrinsic values for stock options exercised during fiscal 2008, 2007 and 2006 were $20.4 million, $28.2 million and $58.8 million,
respectively.
Net cash proceeds from the exercise of stock options for fiscal 2008 were $17.7 million and the associated income tax benefits
were $2.5 million.
Restricted Stock
Restricted stock awards are issued and measured at fair market value on the date of grant and generally become exercisable in
five equal annual installments beginning one to three years from the date of grant. (See “Review of Equity Grants and Procedures
and Related Matters in Fiscal 2006” for a discussion of a special committee review of equity grant matters which resulted in,
among other things, the use of revised measurement dates for certain grants).
NOTES TO CONSOLIDATED FINANCIAL STATEMENTS
(continued)