Bed, Bath and Beyond 2008 Annual Report Download - page 29
Download and view the complete annual report
Please find page 29 of the 2008 Bed, Bath and Beyond annual report below. You can navigate through the pages in the report by either clicking on the pages listed below, or by using the keyword search tool below to find specific information within the annual report.-
 1
1 -
2
-
3
-
4
-
5
-
6
-
7
-
8
-
9
-
10
-
11
-
12
-
13
-
14
-
15
-
16
-
17
-
18
-
 19
19 -
 20
20 -
 21
21 -
 22
22 -
 23
23 -
 24
24 -
 25
25 -
 26
26 -
 27
27 -
 28
28 -
 29
29 -
 30
30 -
 31
31 -
 32
32 -
 33
33 -
 34
34 -
 35
35 -
 36
36 -
 37
37 -
 38
38 -
 39
39 -
40
-
41
-
42
-
43
-
44
-
45
-
46
-
47
-
48
-
49
-
50
-
51
-
52
-
53
-
54
-
55
-
56
-
57
-
58
-
59
-
60
-
61
-
62
-
63
-
64
-
65
-
66
-
67
-
68
-
69
-
70
-
71
-
72
-
73
-
74
-
75
-
76
-
77
-
78
-
79
-
80
 |
 |

BED BATH & BEYOND 2008 ANNUAL REPORT
27
Act of 1940, to maintain minimum asset coverage ratios of 200%. The Company’s trading investment securities include approxi-
mately $41.4 million at fair value, ($43.2 million at par), of auction rate securities which are invested in securities collateralized by
student loans, and which are currently more than 100% collateralized and with approximately 90% of such collateral in the
aggregate being guaranteed by the United States government. During the fiscal third quarter of 2008, and in conjunction with
the execution of the Agreement, the Company reclassified these securities from available-for-sale to trading investment securities
(See “Fair Value Measurements,” Note 6).
None of the auction rate securities held by the Company are mortgage-backed debt obligations, and all of these investments carry
triple-A credit ratings from one or more of the major credit rating agencies as of February 28, 2009. Due to their lack of liquidity,
the Company classified $171.4 million and $319.5 million of these investments as long term investment securities at February 28,
2009 and March 1, 2008, respectively. As a result of the Agreement (see Note 6) entered into in the current fiscal year, the
Company also classified $41.4 million of these investments as long term investment securities at February 28, 2009. During fiscal
2008, approximately $107.6 million of auction rate securities were redeemed at par. Subsequent to the end of fiscal 2008 through
April 20, 2009, the Company additionally redeemed approximately $1.1 million at par.
Other trading investment securities
The Company’s other trading investment securities, which are provided as investment options to the participants of the
nonqualified deferred compensation plan, are stated at fair market value (See “Employee Benefit Plans,” Note 11). The values
of these trading investment securities included in the table above are approximately $6.4 million as of February 28, 2009 and
March 1, 2008 respectively.
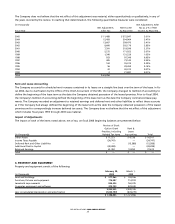
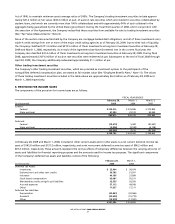
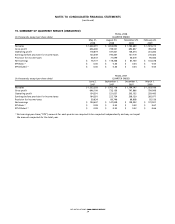
8. PROVISION FOR INCOME TAXES
The components of the provision for income taxes areas follows:
FISCAL YEAR ENDED
February 28, March 1, March 3,
(in thousands) 2009 2008 2007
Current:
Federal $233,216)$276,986)$375,800)
State and local 47,294)23,123)50,060)
280,510)300,109)425,860)
Deferred:
Federal (19,419) 5,483)(81,067)
State and local (2,906) (3,168) (6,158)
(22,325) 2,315)(87,225)
$258,185)$302,424)$338,635)
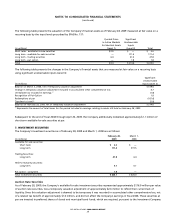
At February28, 2009 and March 1, 2008, included in other current assets and in other assets is a net current deferred income tax
asset of $145.8 million and $137.2 million, respectively,and a net noncurrent deferred income tax asset of $96.2 million and
$81.4 million, respectively.These amounts represent the net tax effects of temporary differences between the carrying amounts of
assets and liabilities for financial reporting purposes and the amounts used for income tax purposes. The significant components
of the Company’sdeferred tax assets and liabilities consist of the following:
February28, March 1,
(in thousands) 2009 2008
Deferred Tax Assets:
Inventories $ 23,904)$ 30,074)
Deferred rent and other rent credits 59,785)51,507)
Insurance 40,198)37,899)
Stock-based compensation 65,081)55,511)
Merchandise credits and gift card liabilities 33,539)26,350)
Accrued expenses 57,113)49,508)
Other 17,637)17,211)
Deferred Tax Liabilities:
Depreciation (20,841) (22,066)
Goodwill (20,502) (15,770)
Other (13,918) (11,591)
$241,996)$218,633)